Bitcoin (BTC) ended the week above $58,000, but it may face challenges in making further gains over the next week. Late summer often brings difficulties for Bitcoin bulls, so BTC might trade sideways for a while.
After a recovery from last week’s yen carry trade sell-off, Bitcoin’s price fell again towards the end of the week, with further declines over the weekend, bringing it back to approximately $58,000.
Bitcoin’s Recent Price Movements and Upcoming Volatility
On Monday morning, Bitcoin fell to $57,700 but managed to recover somewhat. With the weekly stochastic RSI, a momentum indicator, trending downward, Bitcoin may continue to move sideways or see further declines throughout the week.
Additionally, the U.S. government will release Producer Price Index (PPI) and Consumer Price Index (CPI) inflation figures on Tuesday and Wednesday. Although no major changes are anticipated, Bitcoin could experience increased volatility around these announcements.
Bitcoin Short-Term Price Analysis: Fibonacci Levels and Support
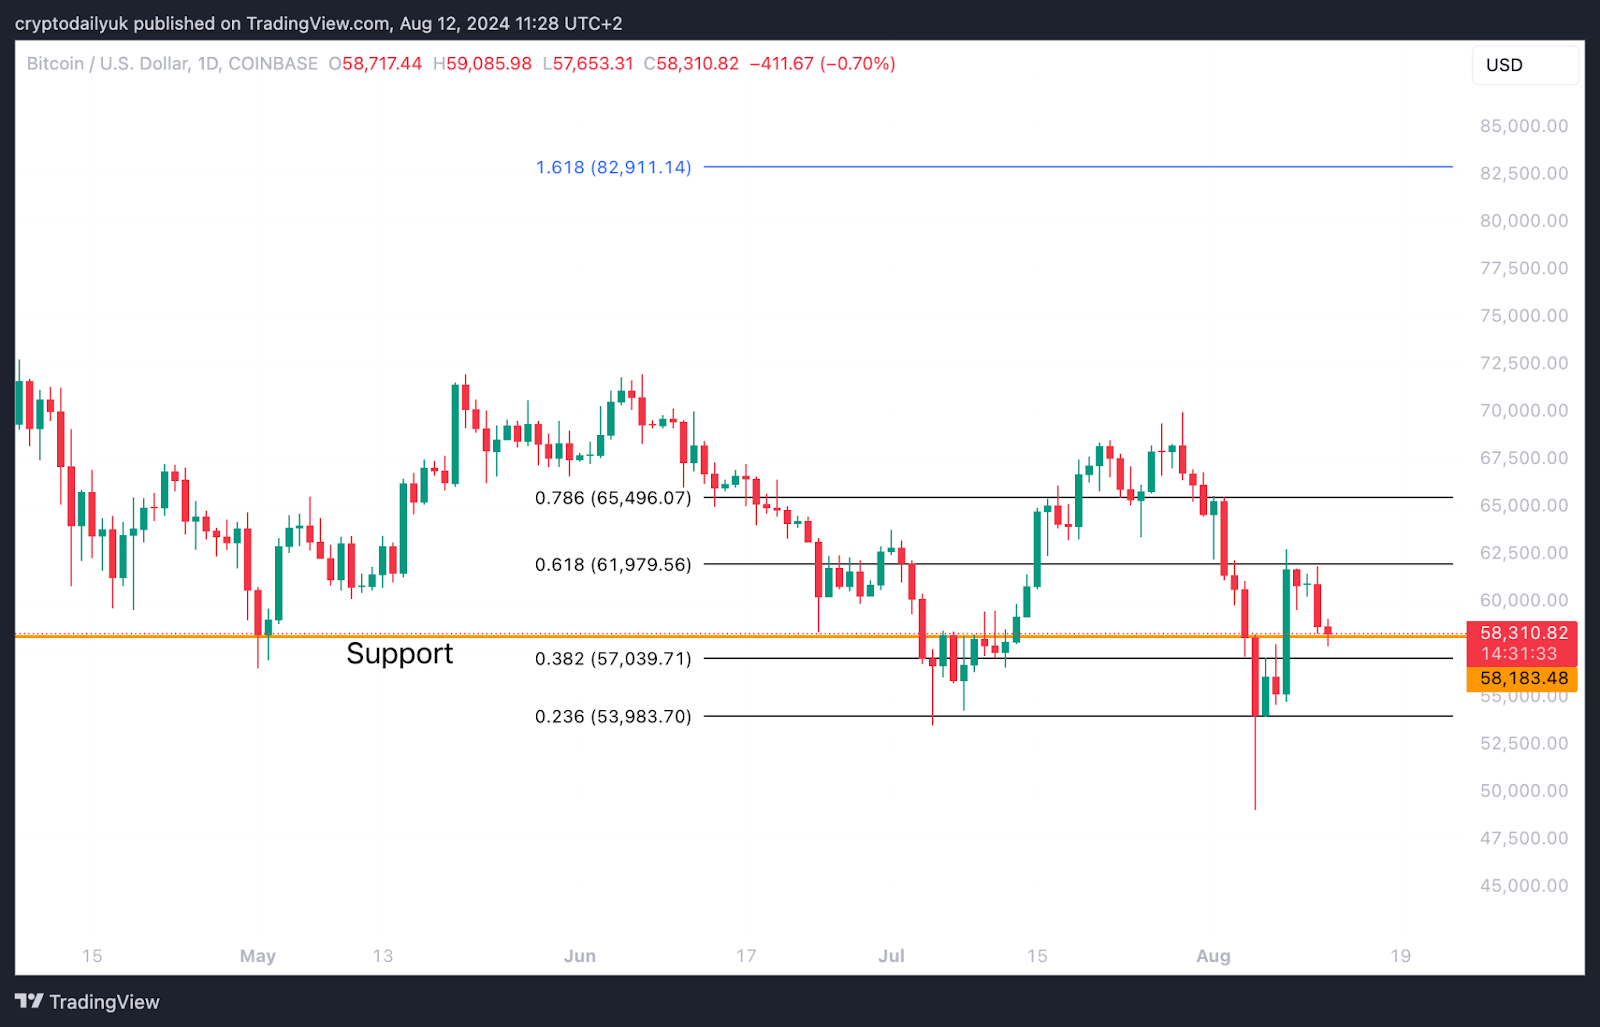
In the short-term 4-hour chart, Bitcoin (BTC) has approached the 0.382 Fibonacci level, which is around $57,500. If the price rebounds from this level, it could signal a bullish trend. However, if it continues to decline, the 0.618 Fibonacci level at $54,300 may offer support.
On the bullish side, the BTC price has established a base around $54,000. Currently, the price is testing the $58,000 support level. If Bitcoin bounces back from here, it might target the 0.618 Fibonacci level at $62,000. Successfully holding above this level could set a new target at $65,500, the 0.786 Fibonacci level.

Source: TradingView
Bitcoin Weekly Outlook: Key Support and Bullish Signals
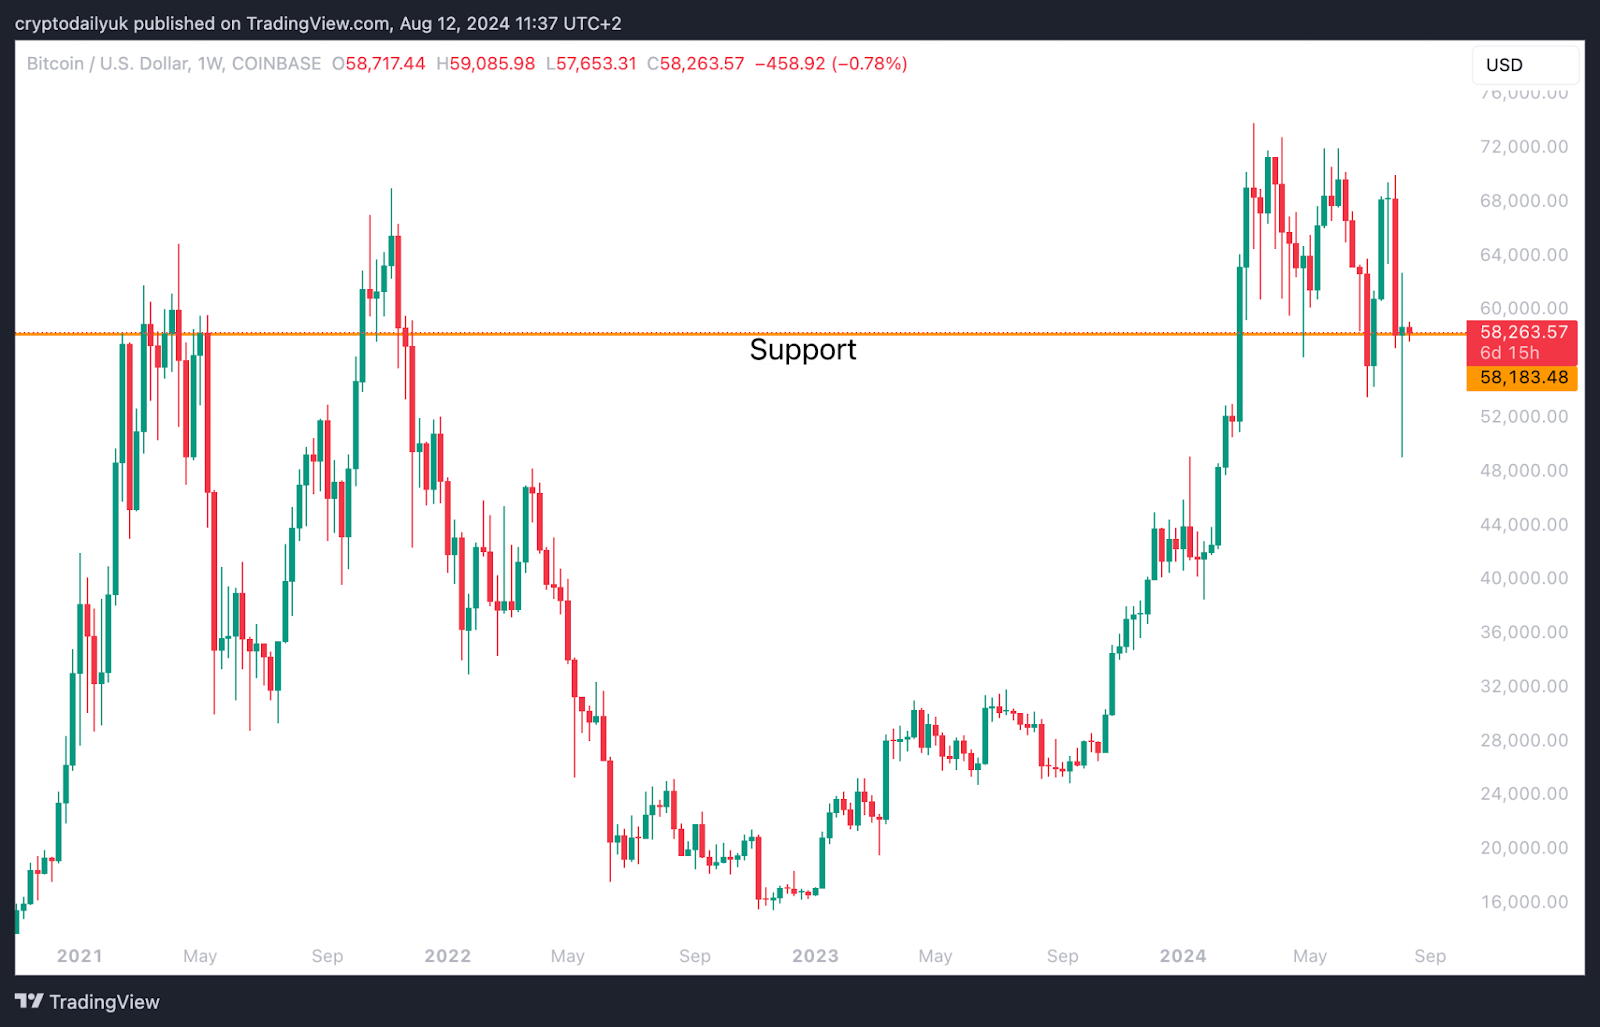
On the weekly chart, it’s crucial for Bitcoin (BTC) to hold the $58,000 level. This price point acted as significant support and resistance at the peak of the last bull market, and it continues to play a vital role in the current market cycle.

Source: TradingView
The long wick observed from the recent selling and buying activity is a potentially bullish sign for future price movement. However, the weekly and 2-weekly stochastic RSIs are still expected to take another week to reach their lows. Following this, it could take a week or two for these indicators to show confirmed bullish signals. While momentum is building, a stronger upward trend may not fully materialize until September.
Important: Please note that this article is only meant to provide information and should not be taken as legal, tax, investment, financial, or any other type of advice.
Join Cryptos Headlines Community
Follow Cryptos Headlines on Google News
Join our official TG Channel: https://t.me/CryptosHeadlines


