Hints at Downside Correction: Can It Hold Key Support?")


- Bitcoin was still in the accumulation zone at press time.
- Long-term investors have good reason to be excited about this cycle’s price performance.
Bitcoin [BTC] was on the rise once more. Despite still having a bearish weekly structure, its move beyond the descending channel gave bulls some hope. The “Super Signal” it flashed recently was seen as a strong bullish sign.
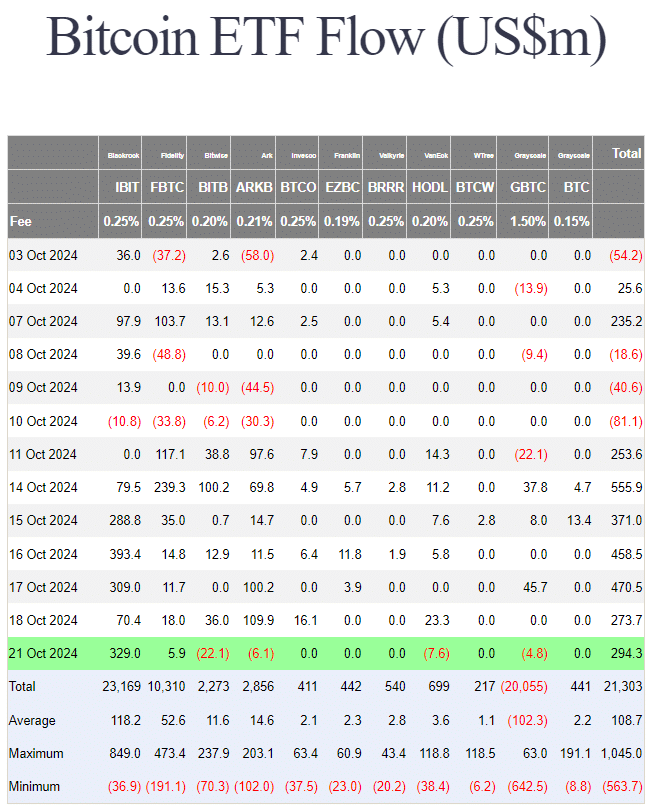
Source: Farside Investors
Data from Farside Investors showed that the previous week saw heavy inflows into the Bitcoin spot ETFs. Through these positive developments, the price of BTC remained below $70k.
Bitcoin Rainbow Chart strongly advocates buying
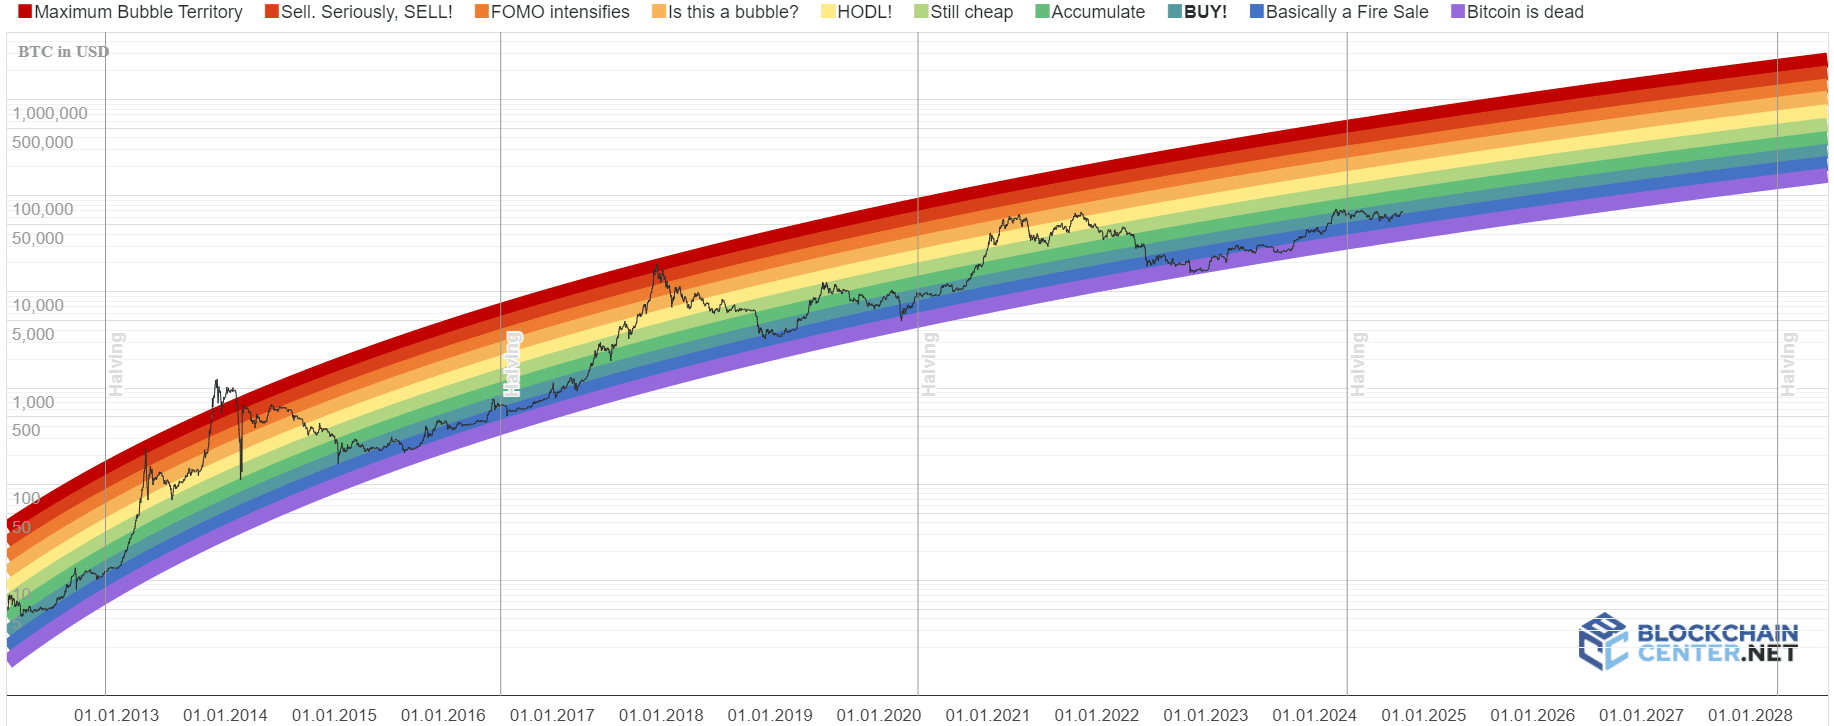
Source: Bitcoin Blockchain Center
The Bitcoin Rainbow Chart is a fun way to look at the price movements of the king of crypto across different cycles. It doubles up as a tool that can be used to assess current long-term bias, and potentially forecast the next cycle’s top.
The chart uses a logarithmic scale to represent the different price bands of BTC and gives a quick insight into whether it is a good time to buy.
Surprisingly, even though Bitcoin is less than 10% below its ATH, the Bitcoin Rainbow Chart revealed that it is still in the “BUY!” zone. The risk when buying is low, and the mindset for investors should be one of HODL.
In the previous cycle, Bitcoin reached a new ATH and slumped dramatically about 336 days after the halving date. It reached a new ATH roughly 18 months later.
If a similar scenario plays out this cycle, Bitcoin would reach a high of $288k in March 2025 and be in the “Is this a bubble?” territory.
A closer look at the weekly chart
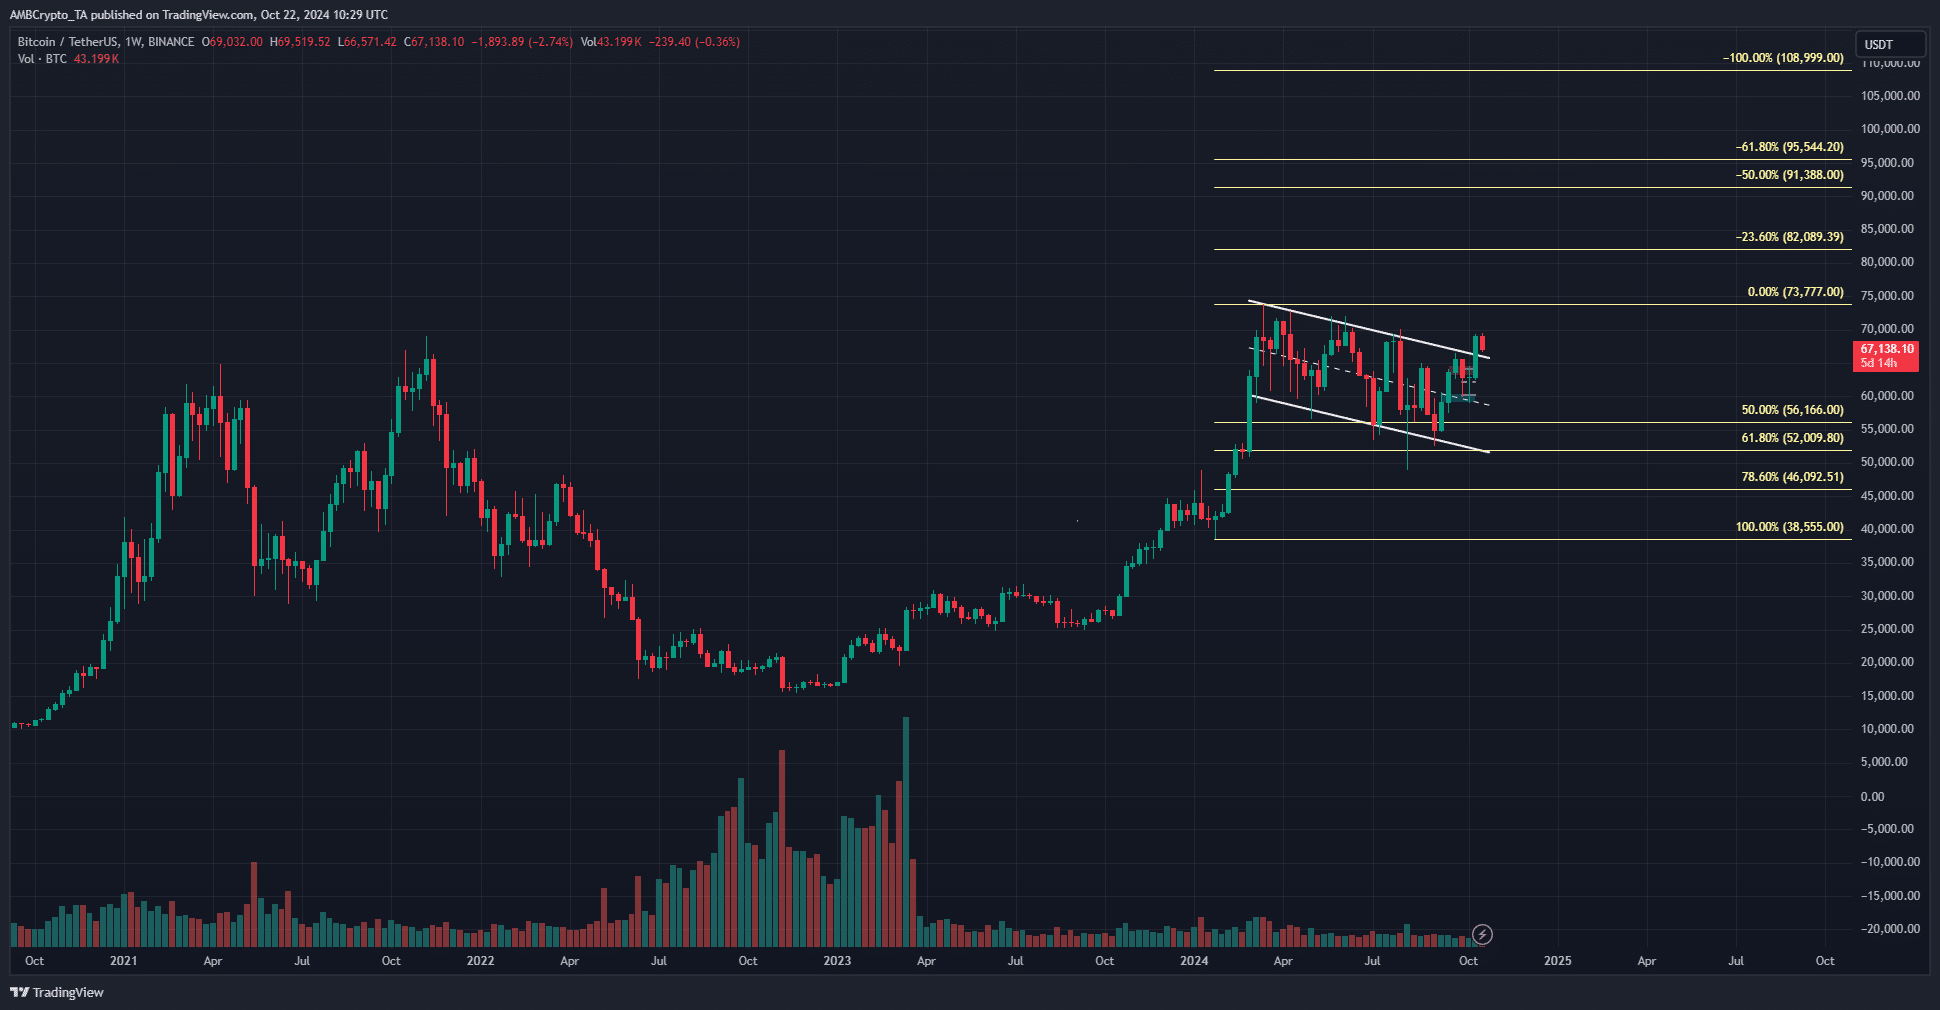
Source: BTC/USDT on TradingView
The findings from the Bitcoin Rainbow chart were enormously bullish. Bulls just need to HODL for 6–9 months more.
Read Bitcoin’s [BTC] Price Prediction 2024-25
Technical analysis of the weekly chart showed the descending channel breakout and the subsequent price targets.
The $82k and $95.5k are the targets for this move. The price has already retraced to the 61.8% retracement level. Breaching the series of lower highs, starting with $70k, would be a good first step.