Bitcoin recent price action shows growing optimism, with institutional and whale activity showing strong signs of support.
The premier crypto asset recently reclaimed the $62K price threshold on the back of the Federal Reserve’s 50 bps rate cut. Amid this push, a combination of institutional futures positioning and whale net flows contribute to the current bullish outlook for Bitcoin.
Institutional Futures and CME Activity
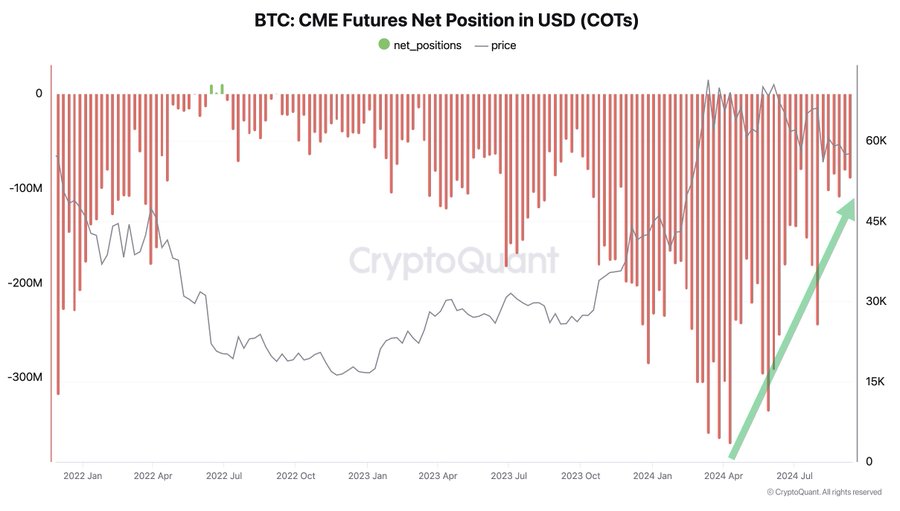
A chart shared today by Ki Young Ju from CryptoQuant shows Bitcoin CME Futures net positions. Over the past five months, there has been a substantial reduction in aggressive shorting by institutional players.


This is observed by the decrease in net short positions, which have declined by 75%, according to Ki Young Ju. This development suggests that institutions are gradually reducing their bearish bets on Bitcoin, a clear shift in market sentiment.
Notably, such aggressive institutional shorting often coincides with periods of price stagnation or decline. However, the reduced shorting activity show a shift toward a more neutral or even bullish outlook from institutions.
Bitcoin Whale Accumulation Shows Confidence
Another chart provided by IntoTheBlock reveals further evidence of bullish sentiment, amid the consistent net positive flows from large Bitcoin holders.
Although $BTC whale accumulation has decelerated, the weekly net flow has stayed positive for nearly four months.
The last instance of a net weekly outflow among large holders was back in May.
🔗https://t.co/NhVCP3gxOd pic.twitter.com/LlZvz7bEma— IntoTheBlock (@intotheblock) September 19, 2024
These “whales,” representing entities holding at least 1,000 BTC, have continued to accumulate Bitcoin over the past four months. Although the pace of accumulation has slowed, the fact that net flows remain positive reflects ongoing confidence in Bitcoin’s long-term value.
The last net outflow from these large holders occurred in May 2024, indicating that whales are still holding and adding to their positions, even amid volatility.
Bitcoin Pushes Toward $63K
Meanwhile, currently trading for $62,968, Bitcoin’s recent price recovery shows strength, as it recently retested the $63,000 region after reclaiming the $62,000 level.
The daily chart reveals that BTC is trading above its upper Bollinger Band at $62,725, which typically indicates that the price is in an overbought zone but can also point to strong momentum.


The Relative Strength Index currently sits at 61.65, approaching the overbought territory, which could suggest that a short-term correction might follow. However, the RSI still has room to move higher before signaling a more significant reversal.
Furthermore, the price action over the past weeks has formed a rounded bottom pattern, a classic bullish reversal signal. If the bulls sustain control, a further push could lead to substantial upward moves, which could take Bitcoin beyond its immediate resistance at $63,000.
Disclaimer: This content is informational and should not be considered financial advice. The views expressed in this article may include the author’s personal opinions and do not reflect The Crypto Basic’s opinion. Readers are encouraged to do thorough research before making any investment decisions. The Crypto Basic is not responsible for any financial losses.


