Bitcoin (BTC) takes the lead in market talks, showing a potential breakout with a tight trading pattern. Despite market uncertainties, the resilient cryptocurrency forms higher highs and lows, signaling a bullish trend.
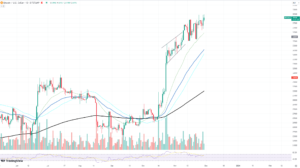
Bitcoin’s daily chart exhibits a rising wedge, a pattern hinting at a potential continuation or reversal after a breakout. The cryptocurrency’s upward movement toward the upper resistance level suggests strong buying pressure, aiming to disrupt equilibrium and chart a new course for price discovery.

Bitcoin/USDT Chart by TradingView
Bitcoin’s Chart Dynamics and Momentum Analysis
A crucial aspect to note is Bitcoin’s proximity to the upper trendline of a wedge pattern. As the cryptocurrency consistently tests this critical level, traders and investors are keenly watching for a decisive breakout or a potential rejection that might prompt a retest of underlying support levels.
Examining the Relative Strength Index (RSI), a momentum indicator, reveals that bullish momentum persists, given its position above the midline. However, caution is advised as the RSI approaches overbought territory, signaling a potential retracement or consolidation.
Supporting the bullish outlook are the moving averages, with shorter-term averages positioned above longer-term ones, indicating sustained bullish sentiment. While the trading volume may not be exceptionally robust, it has been adequate to sustain Bitcoin’s gradual ascent, providing a foundation for incremental price increases.
XRP Faces Resilience Test Amid Market Challenges
XRP finds itself in a challenging market landscape, where most assets are outpacing its growth. Recent price charts show a consolidation pattern for XRP, struggling to establish a clear trend after a notable uptick. The token is currently in a ranging phase, moving within a stable band.
Daily chart indicators like Moving Average Convergence Divergence (MACD) and Relative Strength Index (RSI) present a cautiously optimistic outlook. The MACD hints at a potential bullish crossover, suggesting upcoming upward price movement. However, the RSI, indicating the speed of price changes, resides in a neutral zone, signaling a possible lack of trader conviction.
The critical test lies in XRP’s ability to hold its current support level. A decisive break below could indicate a bearish trend, while maintaining or bouncing off the support may boost investor confidence, potentially triggering a rebound.
LINK Futures on Binance: Anticipation Builds Amidst Market Standoff
The recent price movements of LINK’s futures contract on Binance have created a market standoff, with the price navigating a consolidation pattern, hinting at a potential breakout in the near future.
Analyzing the daily chart for LINK reveals a sense of anticipation. Following a notable surge, the price has entered a consolidation phase, marked by tight movements between support and resistance levels.
A closer look shows LINK forming higher lows, indicating sustained buying interest after each dip—a bullish signal. The upward alignment of moving averages further supports this optimistic outlook. However, a definitive bullish breakout is yet to be confirmed by a substantial increase in trading volume.
The Relative Strength Index (RSI) hovers at a neutral level, signifying that LINK is neither overbought nor oversold. This leaves room for a potential move in either direction. Close monitoring of the RSI is crucial for detecting any divergence that might indicate a shift in momentum.
Important: Please note that this article is only meant to provide information and should not be taken as legal, tax, investment, financial, or any other type of advice.
Join Cryptos Headlines Community
Follow Cryptos Headlines on Google News


