BONK has surged by 25.95% in the last seven days after being inactive for six months. This recent rise puts BONK in a position to potentially reach the $0.000025 level.
As the cryptocurrency market recovers, altcoins are also starting to rise after a long period of decline. Bitcoin (BTC) is trading at $62k, showing a 2.11% increase in the past 24 hours. This recovery has helped altcoins and memecoins, like BONK, see significant gains.
Bonk (BONK) Sees Significant Surge After Prolonged Decline
Popular memecoin Bonk (BONK) surged by 25.95% after struggling through two months of declining trading volume and six months of dormant growth. As of the latest update, BONK was trading at $0.00002369, following a 6.74% increase in the past 24 hours. During this time, its trading volume also rose by 50.90% to $177 million.
According to CoinMarketCap, BONK’s market cap has grown by 6.4% to $1.61 billion within the last 24 hours.
BONK’s Recovery Sparks Market Optimism and Bullish Predictions
BONK has recovered after six months of dormancy, with recent gains reigniting market optimism. Analysts are now predicting a bullish run for the memecoin.
Crypto analyst Freedom By 40 expressed optimism on X (formerly Twitter), noting, “$BONK small time frame update. Going to be a good July imo for BONK.” Similarly, analyst @father_gra22943 forecasted an upcoming bull run, stating, “$bonk is set and ready for a run-up.”
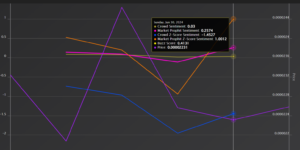
Source: Market Prophit
Current market sentiment reflects this optimism. Analysis from Market Prophit indicates a generally positive outlook, with crowd sentiment at 0.03, a buzz score above zero at 0.04, and Prophit sentiment at 0.25.
BONK’s Technical Indicators and Market Sentiment Signal Bullish Trends
Analysis of the Directional Movement Index (DMI) shows that BONK’s uptrend is gaining strength. At press time, the positive directional index stood at 16.86, above the negative directional index of 15.73. This bullish signal indicates that buying pressure is dominating the market.
Additionally, the On Balance Volume (OBV) line is upward sloping, suggesting that the buying days are stronger than the selling days, which reinforces the buying pressure. The Money Flow Index (MFI) has risen to 54 from a low of 49, signaling a continued uptrend and a shift from sustained selling pressure to rising buying pressure.

Source: Coinglass
Coinglass data shows that liquidations for long positions have been lower since the 25th of June, while short positions have increased. On June 25th, short position liquidations were $262.4k compared to $60.6k for long positions. At press time, short position liquidations were $9.4k, and long positions were $2.3k. This suggests that investors betting against the market are losing, with long holders strengthening their positions.
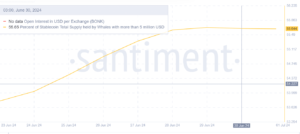
Source: Santiment
Finally, whale activity indicates increased confidence in BONK’s direction. The total supply held by whales has grown from $53 million to $56.6 million in the last seven days, suggesting that whales are accumulating BONK and are likely expecting to sell at a profit. This increase in whale accumulation is another bullish indicator.
BONK’s Price Outlook and Potential Support and Resistance Levels
At press time, BONK was trading at $0.0000238, reflecting an 8.46% gain on the daily charts. If the Money Flow Index (MFI) and Directional Movement Index (DMI) continue to rise, BONK could build strong upward momentum.
If the support level at $0.000022 holds and BONK closes above $0.00002394 on the daily charts, the price may reach $0.000025. However, if the market experiences a correction, the price could decline to the critical support levels of $0.000022 and $0.00002151.
Important: Please note that this article is only meant to provide information and should not be taken as legal, tax, investment, financial, or any other type of advice.
Join Cryptos Headlines Community
Follow Cryptos Headlines on Google News


