Veteran trader Peter Brandt has analyzed XRP price action following the latest drop, critiquing the altcoin and yet suggesting it may be gunning for a bullish move.
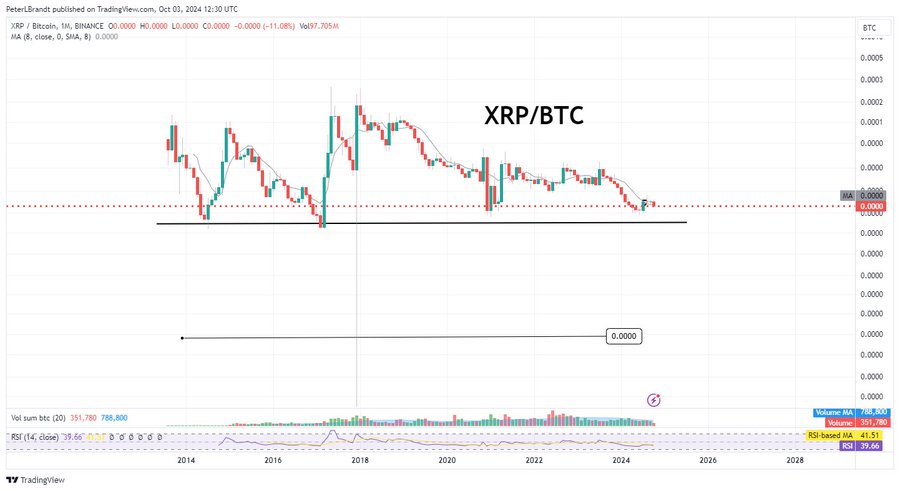
Known for his long-standing criticism of XRP, Brandt recently shared an XRP/BTC monthly chart highlighting what he called an 11-year complex head-and-shoulders (H&S) pattern.
Brandt Pokes at XRP
Mockingly, Brandt argued that if this pattern completes, XRP could drop to zero against Bitcoin. He presented this following a major downturn after the SEC’s appeal notice in the Ripple lawsuit, which caused XRP to drop sharply.
Following reports of the appeal notice, XRP collapsed by 9.77% yesterday, and another 2.95% today. Overall, XRP is down 19.69% over the past four days. Despite the general downturn in the broader market, XRP’s sharper decline led to a 9.47% intraday crash in the XRP/BTC chart.
However, Brandt’s chart shows that the recent collapse led to XRP hitting a significant support level against BTC. Notably, this level has acted as a range low where the altcoin typically bounces back. If XRP respects this support, there is potential for another rebound.


The market has on multiple occasions tested the long-standing range between 0.00000857 BTC and higher resistance levels above 0.00002000 BTC. Amid the latest drop, XRP collapsed to a two-month low of 0.00000843 BTC today, but has since recovered, now trading at 0.00000863 BTC.
XRP’s ability to hold this range low suggests that the bearish outlook may not be as clear-cut as Brandt’s criticism implies. The veteran trader’s subsequent remarks on XRP’s price action confirmed this.
XRP Might be Setting up for a Bull Move
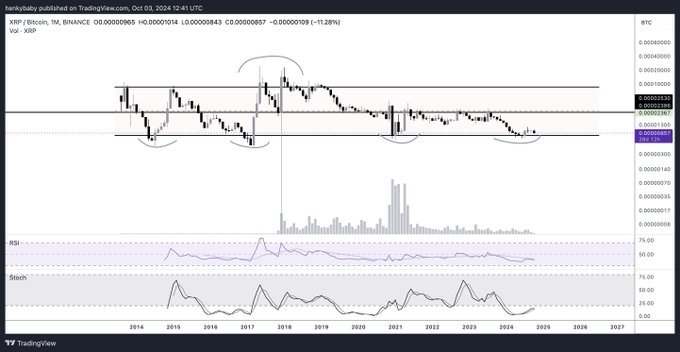
Notably, another seasoned trader responded to Brandt’s criticism, sharing a different view. This trader presented a similar XRP/BTC monthly chart but confirmed the strength of the support at the range low.


He pointed out that while Brandt may expect a collapse, XRP is currently sitting at a level where previous bounces occurred. The trader noted that XRP has consistently bounced from this range, with a “beautiful range” forming between the lows and highs over the years.
Interestingly, Brandt agreed with the suggestion of a possible reversal. He affirmed that his earlier report was an attempt at riling up XRP enthusiasts, whom he has persistently criticized over the years.
Actually a possibility that XRPUSD displays continuation triangle for a bull move. You know me well enough to know that some of the posts I make are aimed at poking fun at the dogmatic bulls of the various junk coins 🤣🤣😉😉
— Peter Brandt (@PeterLBrandt) October 3, 2024
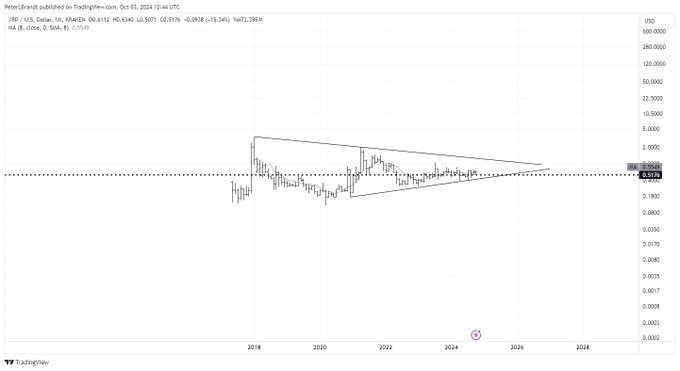
To support the bullish outlook, Brandt shared an XRP/USD monthly chart. Despite his critiques, the market veteran acknowledged the possibility of a bullish continuation triangle forming.


The chart highlights a symmetrical triangle that could lead to a breakout. As XRP/USD trades around $0.5176, it finds itself consolidating within the triangle, which formed in January 2018. Data shows that XRP is near the apex of this triangle, and a breakout may be imminent.
Major Resistance at 8 SMA
The XRP/USD chart also shows the 8-period SMA ($0.5560) acting as resistance, which XRP has struggled to break in recent months. XRP closed September above this moving average but has now dropped below it amid the recent crash.
However, if XRP manages to break above the new resistance level, it could trigger a significant bullish move, bolstered by the completion of the triangle. If the pattern plays out, XRP/USD could see a major upside, with the next resistance level at $1.00.
Disclaimer: This content is informational and should not be considered financial advice. The views expressed in this article may include the author’s personal opinions and do not reflect The Crypto Basic’s opinion. Readers are encouraged to do thorough research before making any investment decisions. The Crypto Basic is not responsible for any financial losses.


