


Bitcoin (BTC) has struggled to stay above $55,000, leading to an 8% market correction in the last 24 hours. This drop has caused major tokens to fall below their key support levels. Following this trend, BRC-20 tokens have also seen significant losses.
Top BRC-20 tokens like ORDI and SATS have dropped 17.38% and 26.71% respectively over the past day. In this article, we explore the market sentiments and price analysis of Ordi (ORDI), Bitcoin SV (BSV), and 1000SATS (SATS) to assess their potential targets for July.
Ordi (ORDI) Faces Major Correction Amid Crypto Market Downturn
Ordi (ORDI) has seen a significant price correction of over 17% amid the current crypto market downturn. The altcoin’s 24-hour trading volume stands at $278.177 million, reflecting a notable increase of 92.42%. Year-to-date, ORDI has plunged by 64.60%, underscoring a persistent bearish trend.
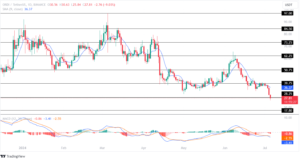
ORDI/USDT: TradingView
The MACD indicator shows a rising red histogram, signaling increasing selling pressure and a bearish sentiment in the market. The technical averages support this outlook, suggesting that ORDI might continue to face downward pressure this week.
However, if ORDI can maintain its price above the critical support level of $28.25, it could regain bullish momentum and attempt to test the upper resistance level at $50.75. On the other hand, if bearish trends persist, ORDI may drop to test its low of $17.80.
1000SATS (SATS) Struggles with Severe Decline Amid Market Correction
Following the lead of the top BRC-20 token, 1000SATS (SATS), the second-largest BRC-20 token by market cap, has experienced a dramatic drop of over 27% in the past day and 62.82% in the past month. The token has plummeted by 84.76% this year, reflecting a strong bearish sentiment.

SATS/USDT: TradingView
The MACD indicator shows a flatline in its histogram, signaling weak price action for SATS. Additionally, the moving averages are displaying a neutral trend, indicating uncertainty about future price movements.
The SMA indicator is consistently acting as resistance on the SATS price chart in the 1D time frame, reinforcing the bearish sentiment surrounding the altcoin.
Important: Please note that this article is only meant to provide information and should not be taken as legal, tax, investment, financial, or any other type of advice.
Join Cryptos Headlines Community
Follow Cryptos Headlines on Google News
Author