In the last few months, the prices of many cryptocurrencies have been going up and down a lot. Some of the big tokens gained a lot of value. But interestingly, BRC-20 tokens, which are not talked about as much, have been doing really well.
While everyone was focused on famous tokens and the risky categories like Memecoins, DeFi, and the Metaverse, BRC-20 tokens quietly outperformed everything, multiplying their value just in this month.
ORDI Price Analysis: Trading Range and Potential Scenarios
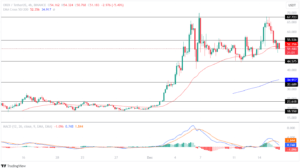
The ORDI token has been trading within a narrow range, fluctuating between $18.550 and $23.618 for more than three weeks. Despite a positive start in December with a massive 265% surge in the first week, the price faced rejection at $67.723.
Following the rejection, ORDI entered a consolidation phase, moving between $44.575 and $55.536 for over a week. Recent attempts to break the key resistance at $67.723 resulted in a short-lived rally, leading to a pullback.

TradingView: ORDI/USDT
The Moving Average Convergence Divergence (MACD) highlights increased selling pressure, with a rising red histogram and declining averages, indicating a potential continued decline in price.
Bulls have an opportunity to regain control by pushing the price above $55.536, setting the stage for a test of the upper resistance at $67.723 in the coming days.
On the downside, a failure to hold above the crucial support at $44.575 may lead to further declines, testing the lower support level at $33.689 in the near future.
SATS Price Analysis: Similar Patterns and Potential Movements
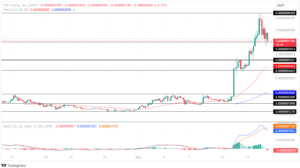
The SATS token has mirrored the price action of the ORDI token, trading within a narrow range of $0.0000001898 to $0.0000002689 before experiencing a loss of bullish momentum.
Following this, SATS moved between $0.0000001218 and $0.0000001898 for over two weeks. A breakout occurred as bulls gained strength, but the token continued trading within a range of $0.0000001898 to $0.0000002689 for about ten days.
Despite a notable 400% surge within a week, the price faced rejection, leading to a correction of over 25%. The MACD indicator signals a strong bearish influence, with a sharp rise in the red histogram and bearish convergence in the averages, indicating a potential significant correction.

TradingView: SATS/USDT
Bulls have an opportunity to regain control by maintaining the price above the support at $0.0000007014, setting the stage for a test of the resistance level at $0.0000009428 in the coming days.
However, if bears persist, the SATS token price may see further declines, targeting the support level of $0.0000005521 this month.
Important: Please note that this article is only meant to provide information and should not be taken as legal, tax, investment, financial, or any other type of advice.
Join Cryptos Headlines Community
Follow Cryptos Headlines on Google News


