- Bitcoin’s leverage ratio climbed to a 2-year high, fueling fears of over-leveraging
- On the price charts, BTC appreciated by 10.21% over the past week
The last 7 days saw Bitcoin climb to a new ATH on the price charts. As expected, the cryptocurrency’s new ATH of $77,270 spurred significant market euphoria, with the same resulting in an increase in leverage across the board.
A different type of ‘high’
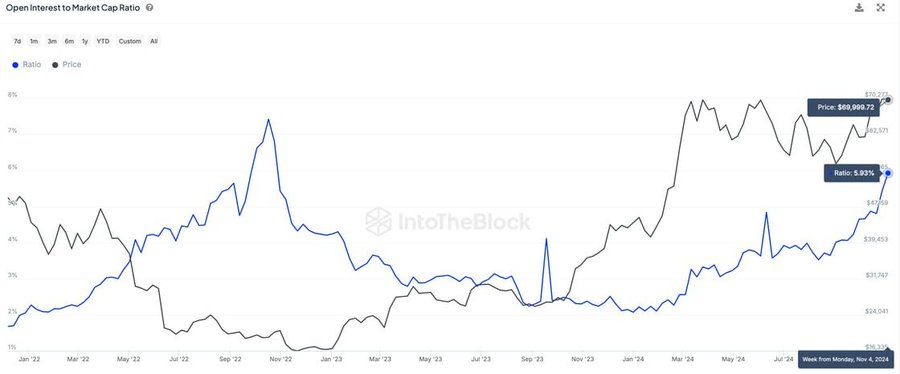
According to an analysis of IntoTheBlock, BTC’s leverage ratio climbed to a 2-year high recently.
According to the same, the Open Interest in BTC perpetual swaps relative to its market cap reached levels unseen since the 2022 collapse of FTX.
When we say that BTC’s leverage is at 2 year high, it means that more traders are using borrowed funds to trade BTC than they have over the past 2 years. This ratio compares the amount of Open Interest to the crypto’s market cap.
A higher leverage ratio is consequential because it indicates that investors are increasingly confident in their bets on Bitcoin’s price movement. This usually leads to volatility, when leverage is high. In fact, even a small price movement can trigger liquidations, thus resulting in bigger price swings.
Here, it’s worth noting that when the leverage ratio spiked in 2021, as a consequence of deleveraging, a market correction followed. This mainly arises because a small move results in higher liquidations, cascading to a bigger market drop.
Simply put, a rise in the leverage ratio points to a potential market pullback towards sustainable levels.
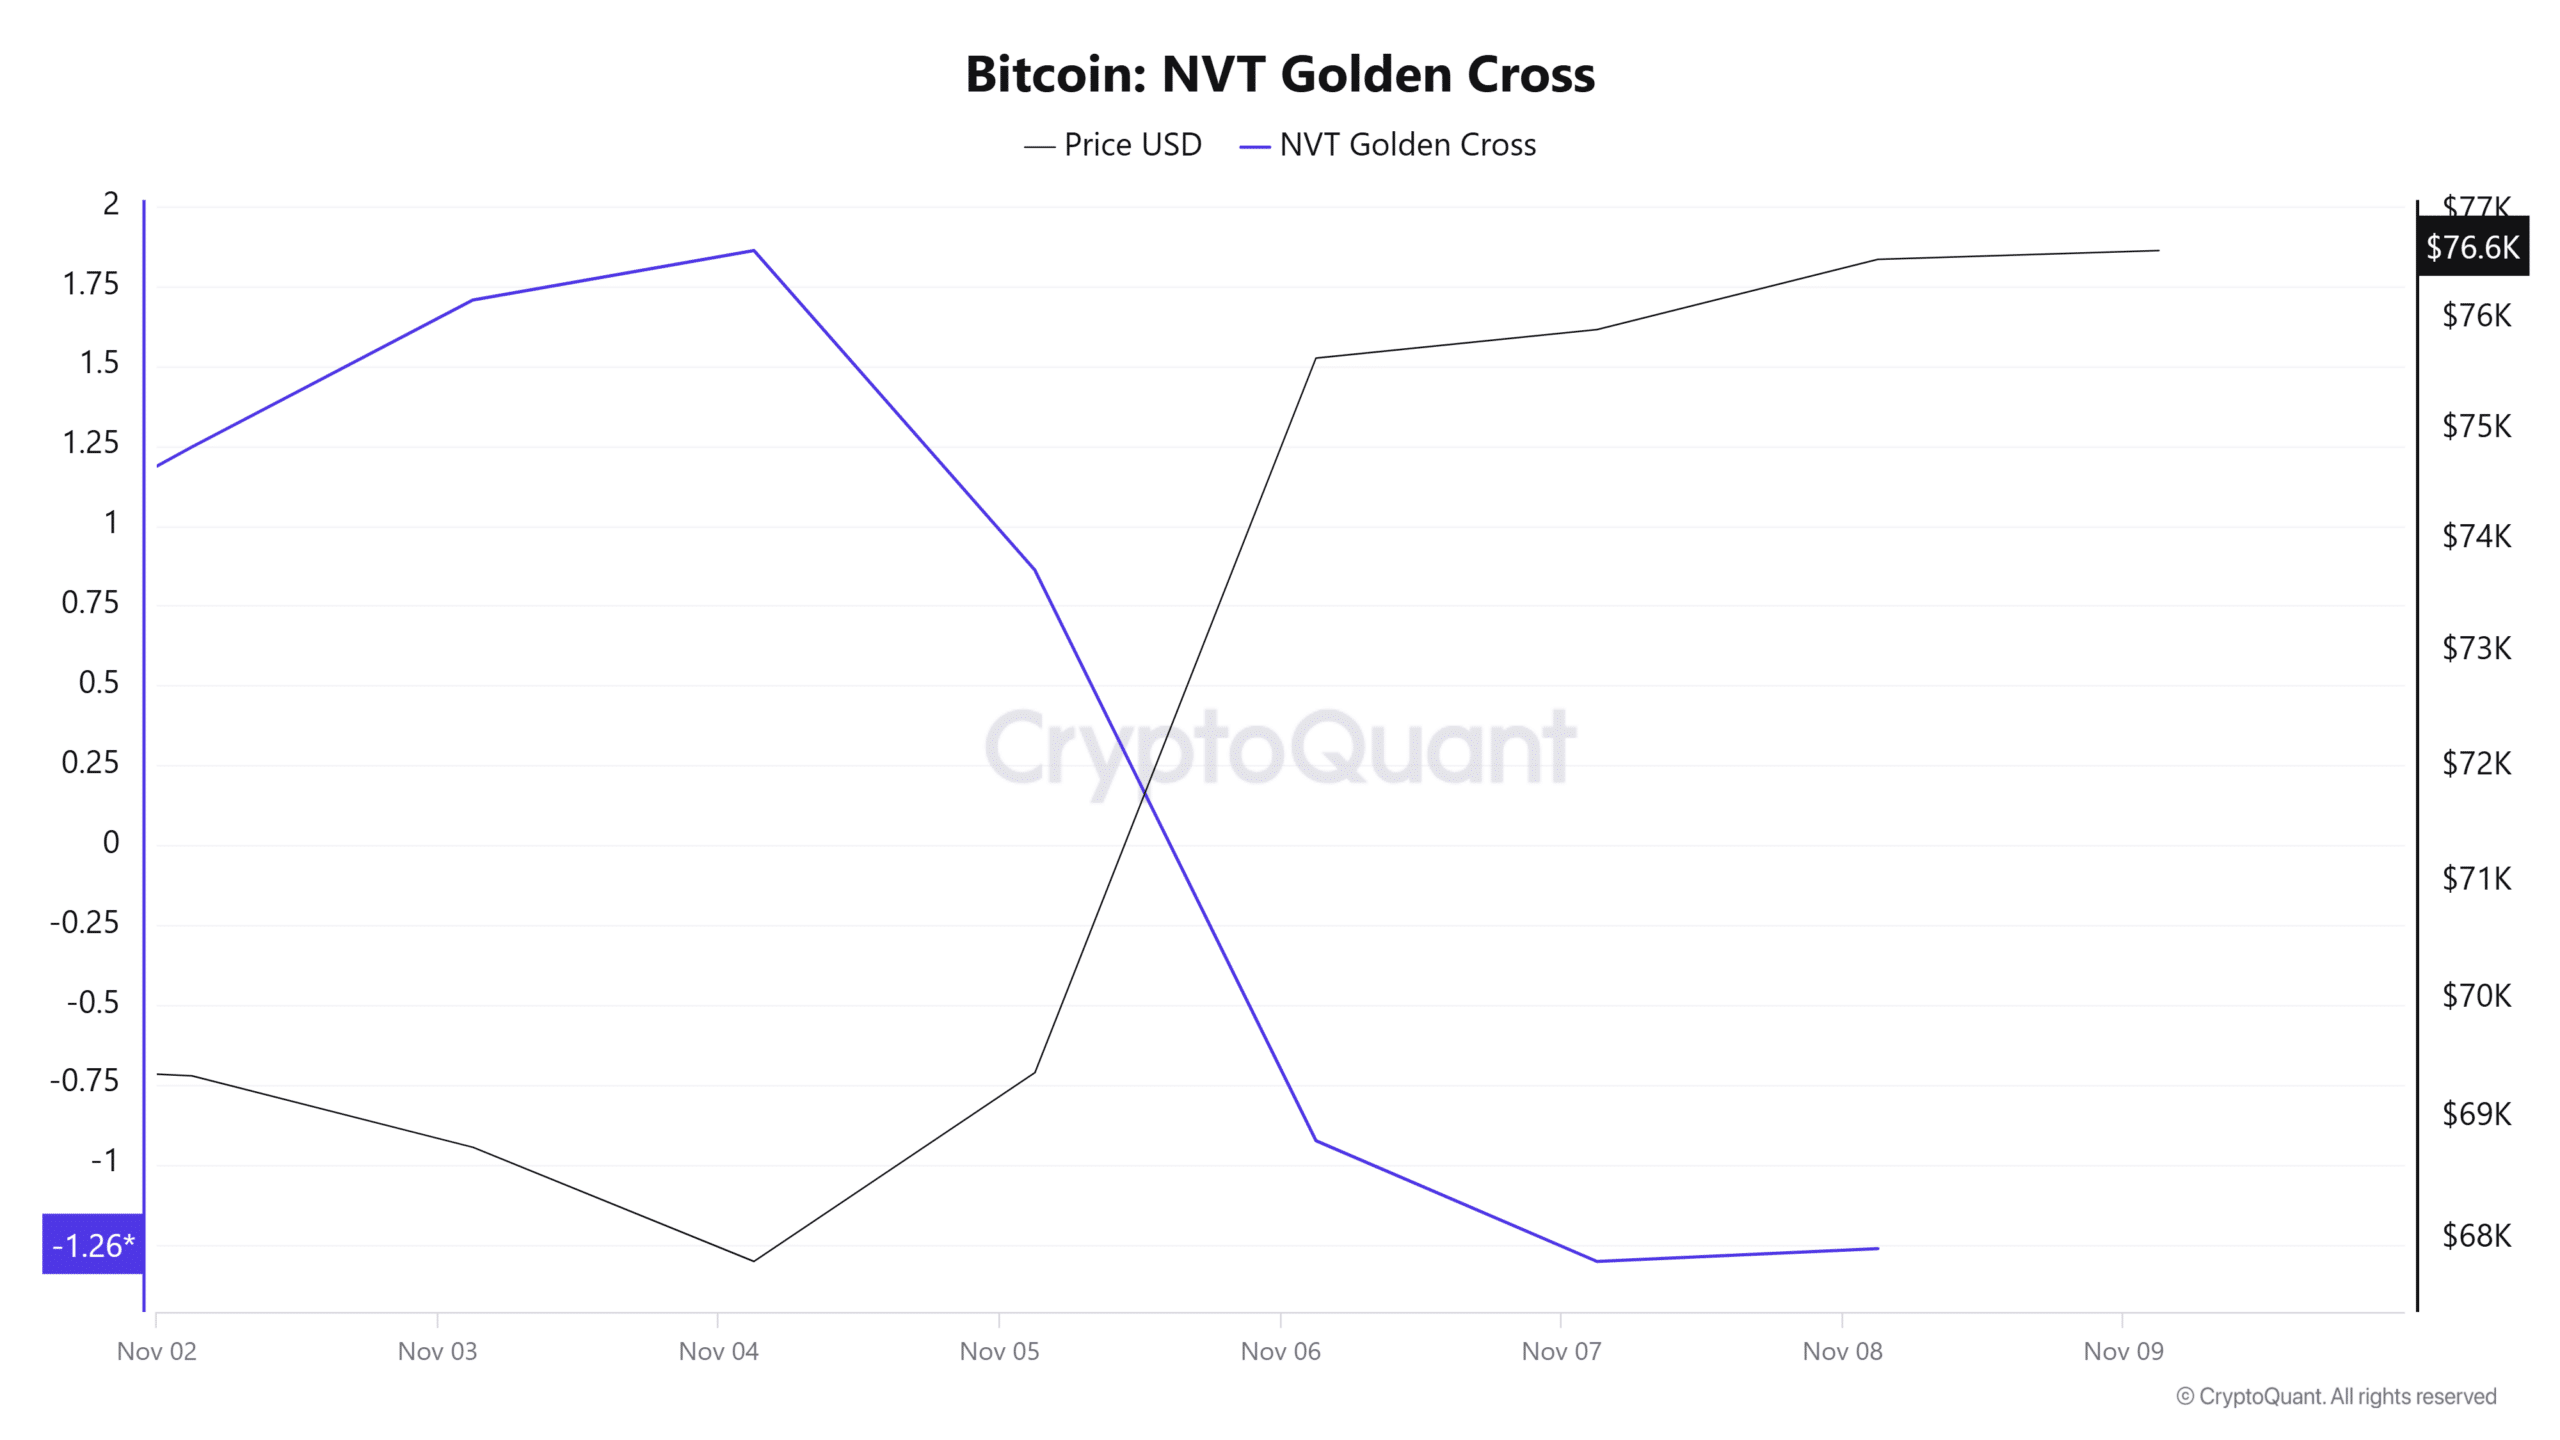
This potential unsustainability of the rally seemed to be supported by a declining NVT Golden Cross.
While a golden cross is a bullish signal, a declining NVT Golden cross means that the ongoing price surge may be driven by speculative investments, rather than strong usage of the network. Thus, the asset might be overvalued based on network usage.
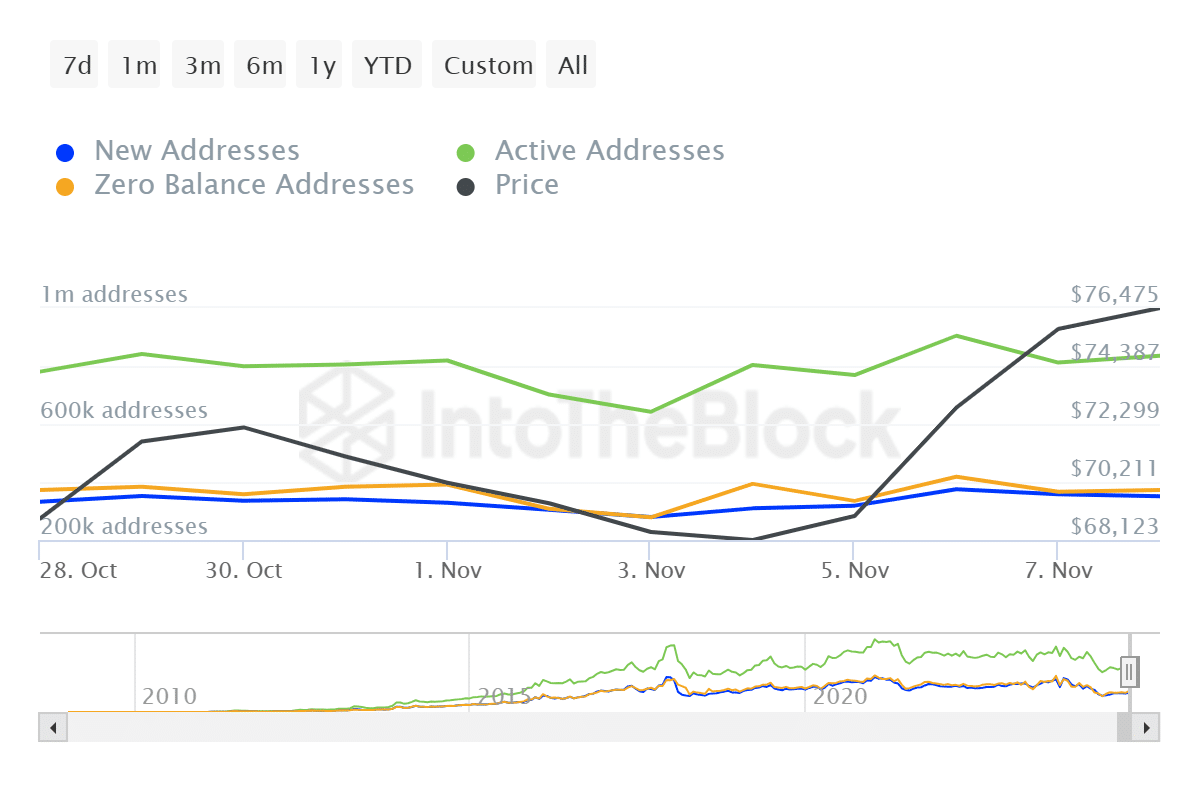
This phenomenon can be further supported by a drop in active addresses. As such, since peaking at 901k, active addresses declined to 835k, according to IntoTheBlock.
A decline in active addresses implies lower usage and network participation.
What it means for BTC’s price charts
Over-leveraging usually makes the market more sensitive to price changes.
When a large portion of the market is over-leveraged, even small price drops can trigger a wave of liquidations leading to sharp sell-offs and high volatility. When this happens, Bitcoin’s price will register a pullback to find support at around $73,600.


