Bitcoin is maintaining proximity to the $38,000 resistance, anticipating the release of the November 1 minutes by the Fed. The current trend suggests ongoing BTC accumulation, with expectations of a pre-halving rally in 2024.
Current Market Over View
Following Monday’s bullish resurgence, the market has stabilized, with Bitcoin edging closer to the crucial $38,000 resistance but pausing at $37,625. Altcoins, including Ethereum, mirrored BTC’s movement, sustaining levels above the crucial $2,000 support. Notably, Binance Coin demonstrated strength, marking a 4.5% increase to $258 on Tuesday.
However, the last 24 hours witnessed a general correction in altcoins, led by Solana experiencing a 6.3% dip to $56. Among the top ten digital assets, the majority are in the red, with the exception of stablecoins USDT and USDC.
Despite this, Bitcoin’s price has remained relatively stable as bulls consistently challenge the immediate $38,000 resistance. Analyst @CryptoFaibik, sharing insights on Twitter (now X), suggests that Bitcoin could surge to $41,000 “if BTC bulls successfully clear the $38k resistance.”
If $BTC bulls Successfully Clear the 38k Resistance and Next Stop could be 41k.#Crypto #Bitcoin #BTC #BTCUSDT pic.twitter.com/X26xCLX9oG
— Captain Faibik (@CryptoFaibik) November 20, 2023
Bitcoin Price Faces Resistance at $38,000 as Bulls Encounter Challenges
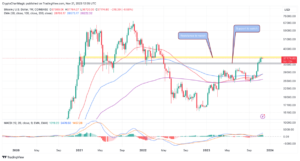
Bitcoin currently hovers between key levels: facing seller congestion at $38,000 and finding support at $36,000. The short-term technical outlook, assessed through the Moving Average Convergence Divergence (MACD) indicator, suggests a likelihood of gains above $38,000 rather than a pullback to $36,000.
The MACD indicator exhibits a buy signal and maintains its position above the neutral zone. If the blue MACD line continues its upward trajectory while staying above the red signal line, the path of least resistance appears to favor the upside.

Bitcoin price prediction weekly chart | Tradingview
The weekly timeframe adds weight to the bullish sentiment with an ongoing bullish cross. The golden cross pattern emerges as the 50-week Exponential Moving Average (EMA) (red) surpasses the 200-week EMA (purple). Traders often interpret this pattern as a confirmation of a generally bullish market outlook, and its presence on the weekly chart reinforces a long-term bullish thesis.
Anticipating the release of the Federal Reserve’s November 1 FOMC meeting minutes, Bitcoin’s reaction is expected to be limited. The prevailing trend indicates that BTC tends not to react significantly to Fed actions, especially considering the committee’s pause on interest rate hikes in recent months.
Despite the Fed’s indication of a single rate hike before year-end, weak economic data released post-meeting has raised expectations for no further rate hikes. Analysts at ING note that the minutes’ release is likely to be less market-moving than usual, given the softer post-meeting data and cautious statements from Fed officials.
Bitcoin Halving Approaches in 5 Months
As the Bitcoin price encounters resistance at $38,000, investors are gearing up for increased accumulation, anticipating the halving event just five months away. In the coming weeks, investors may strategically buy the dips to maximize gains during the expected pre-halving rally.
According to crypto analyst @Rekt Capital, historical trends indicate that deeper retracements during this period often lead to significant Return On Investment (ROI) for investors in the months following the halving.
5 Phases of The Bitcoin Halving
1. Pre-Halving period
Approximately 5 months remain until the Bitcoin Halving in April 2024
Historically, any deeper retraces that occur during this period tend to generate fantastic Return On Investment for investors in the several months… pic.twitter.com/YuhxffF0Ei
— Rekt Capital (@rektcapital) November 20, 2023
Ideally, a pre-halving rally is anticipated to unfold approximately 60 days before the halving event, as investors flock to BTC, driven by expectations of potential price surges.
Bitcoin typically undergoes multiple rallies before and after halving, often resulting in a parabolic uptrend several months after the event.
Important: Please note that this article is only meant to provide information and should not be taken as legal, tax, investment, financial, or any other type of advice.
Join Cryptos Headlines Community
Follow Cryptos Headlines on Google News


