Cardano (ADA) is poised for a massive rally potentially following its recent descending trendline breakout in this ongoing market reversal. In addition to the trendline breakout, ADA has also formed a bullish cup-and-handle price action pattern on the daily timeframe and is on the verge of a breakout.
Cardano (ADA) Technical Analysis and Upcoming Levels
According to expert technical analysis, ADA is currently facing strong resistance near the $0.365 level. If it breaks this resistance level and closes a daily candle above the $0.366 level, there is a strong possibility that ADA could soar by 23% to reach the $0.44 level in the coming days.
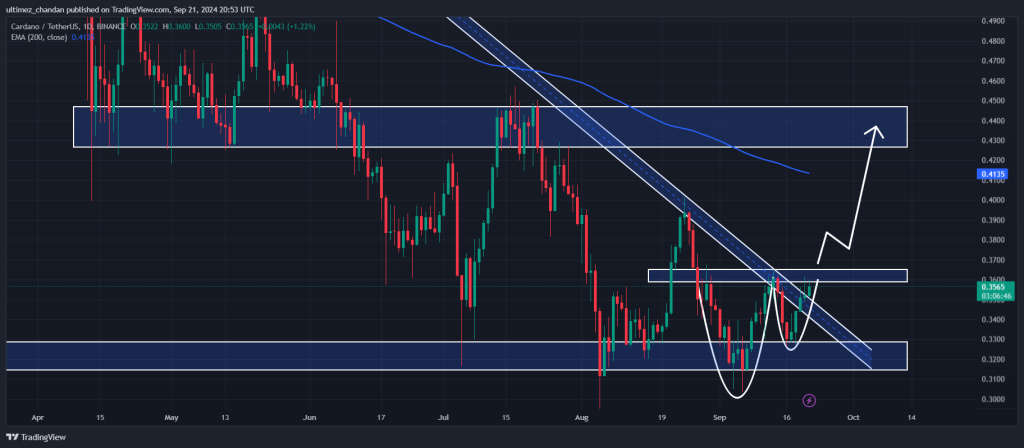
Additionally, ADA is in a downtrend as it is currently trading below the 200 Exponential Moving Average (EMA) on a daily time frame, indicating a downtrend. The 200 EMA is a technical indicator used by traders and investors to determine whether an asset is in an uptrend or downtrend.
Despite being in a downtrend, both bullish price action patterns on the ADA daily chart hint at potential buying opportunities and a significant upside rally in the coming days.
ADA’s Bullish On-chain Metrics
On the other hand, Cardano’s (ADA) on-chain metrics further support this positive outlook. Coinglass’s ADA Long/Short ratio currently stands at 1.025, indicating bullish market sentiment among traders. Additionally, its future open interest has increased by 3.5% in the last 24 hours and has been steadily rising since the beginning of September 2024.
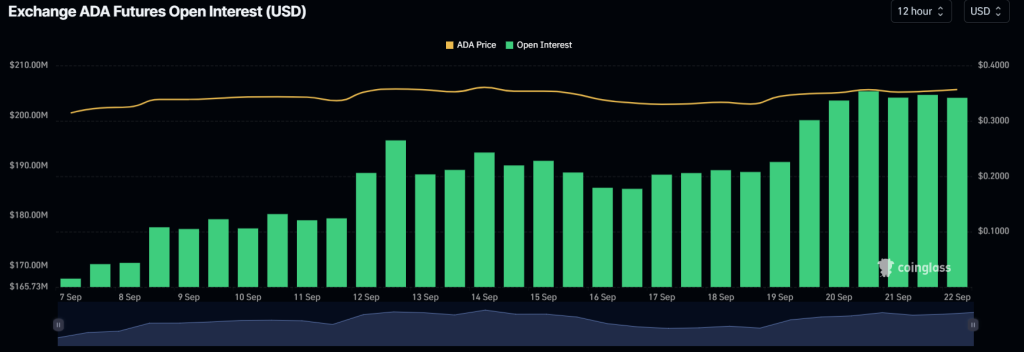
This growing interest from traders and investors suggests a buildup of more long positions, signaling a potential breakout from both patterns.
At press time, ADA is trading near $0.357 and has experienced a price surge of over 2% in the last 24 hours. During the same period, its trading volume dropped by 40%, indicating lower participation from traders.


