Could Increase 10 Times to $1 If This Occurs")


Cardano (ADA) is currently facing resistance around the 50-day Simple Moving Average (SMA) on its daily chart, posing a crucial juncture for traders to monitor.
On Wednesday, Cardano showed a downtrend for the third consecutive session. Despite initial gains earlier in the week, the bulls struggled to maintain momentum. The price has been trading within a short-term range of $0.42 to $0.52, with resistance evident at the upper boundary. Attempts by bulls to surpass this level have faltered, suggesting a lack of bullish strength in the current market conditions.
Cardano (ADA) Price Analysis: Current Trends and Predictions
As of the latest update, ADA/USD is trading at $0.48, showing a modest increase of 0.21% for the day. However, the 24-hour trading volume has decreased by more than 24% to $374 million. This combination of price increase and declining volume may indicate that the current upswing could lack sustainability.
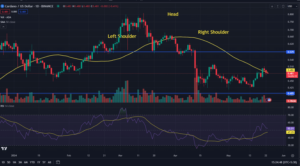
Cardano-ADA-1-day. Source-TradingView
Currently, Cardano’s price movement appears subdued with no clear directional bias. Traders are closely watching if ADA can break above the 50-day Simple Moving Average (SMA), which could pave the way for further gains towards $0.51, followed by the high of $0.56 seen on February 13. The Relative Strength Index (RSI), a momentum oscillator, supports this potential upward movement.
Conversely, if bearish sentiment prevails in the volatile market environment, ADA might face downward pressure. A key immediate support level to watch is at $0.45, identified from the May 17 candle. A breach below this level could confirm a range-bound market structure, potentially pushing ADA towards the critical support zone around $0.42.
In summary, Cardano’s current price action reflects a pivotal moment where bulls and bears are in a tug of war. A decisive move above the 50-day SMA could favor bulls, while a drop below this level may empower bears to exert further downward pressure on ADA’s price.
Cardano (ADA) Technical Analysis: Current Support and Resistance Levels
As of the latest update, Cardano (ADA) is trading below its 50-day Simple Moving Average (SMA), which is currently at $0.48.
The Relative Strength Index (RSI), with a period of 14, is above 50, suggesting a bullish bias in the market sentiment.
Support Levels
Support 1: ADA has initial support at $0.46, where buying interest may increase if the price declines.
Support 2: A stronger support level lies at $0.42, marking a critical zone where significant buying activity could be expected.
Resistance Levels
Resistance 1: The first resistance level stands at $0.50, where selling pressure may intensify if ADA attempts to rise.
Resistance 2: Beyond $0.50, ADA faces another hurdle around $0.52, representing a potential higher resistance level for the cryptocurrency.
These levels provide crucial points for traders to monitor, indicating potential areas of price action and market sentiment shifts for Cardano (ADA) in the near term.
Important: Please note that this article is only meant to provide information and should not be taken as legal, tax, investment, financial, or any other type of advice.
Join Cryptos Headlines Community
Follow Cryptos Headlines on Google News
Author