
 Shoots Up by 33% Daily, Bitcoin (BTC) Maintains $90K (Market Watch)")


Chainlink (LINK) surged to $16.21 on June 12, only to retreat shortly afterward, indicating that the initial price increase might have been a false breakout.
Despite this, interest in the native token of the decentralized Oracle network remained strong, with trading volume exceeding $450 million in the last 24 hours.
Chainlink (LINK) Metrics Suggest Potential for Uptrend
As of the latest update, Chainlink (LINK) is trading at $15.55, marking a 10.65% decline over the past seven days. The recent surge in LINK’s price on Wednesday was spurred by favorable Consumer Price Index (CPI) data, which showed lower-than-expected inflation rates.
Initially, this positive CPI outcome boosted the broader crypto market, including LINK, leading to significant gains. However, subsequent market movements, especially with Bitcoin (BTC) and other altcoins, tempered some of these gains.
Despite the recent decline, indicators like the Network Value to Transaction (NVT) Ratio and Market Value to Realized Value (MVRV) Ratio suggest that LINK may be poised for another uptrend:
Network Value to Transaction (NVT) Ratio: This metric, calculated by dividing the market capitalization by the transaction volume on-chain, helps determine if a network is undervalued or overvalued. Glassnode data shows Chainlink’s NVT Ratio at 93.04, indicating that transaction volume has been robust relative to the project’s market cap. A lower NVT Ratio typically suggests undervaluation, as the network efficiently processes transactions despite the current price levels.
Market Value to Realized Value (MVRV) Ratio: This ratio compares a cryptocurrency’s market value to its realized value, providing insights into potential accumulation or distribution levels. It helps traders assess whether the token’s price has peaked locally or is nearing a bottom. For Chainlink, these metrics point towards potential opportunities for accumulation, reflecting its current undervalued status in the market.
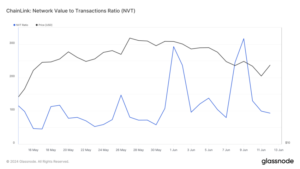
Chainlink Network Value to Transactions Ratio. Source: Glassnode
These metrics collectively indicate that despite recent price fluctuations, Chainlink may be in a favorable position for a future uptrend, supported by strong transactional activity and market fundamentals.
Chainlink (LINK) On-Chain Metrics and Historical Patterns
Recent insights from Santiment highlight Chainlink’s 30-day Market Value to Realized Value (MVRV) ratio at -9.02%. This negative figure suggests that current LINK holders may face losses if they sell at prevailing prices around this range.
However, historical data indicates that such downturns often present buying opportunities for investors:
Historically, when Chainlink’s MVRV ratio has fallen between -6% and -21%, it has signaled potential for price rebounds. For instance, from May 15 to 28, LINK’s price surged from $12.96 to $18.77. This rally coincided with a starting MVRV ratio of -6.45%.
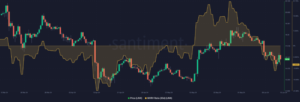
Chainlink 30-day MVRV Ratio. Source: Santiment
In another example in April, with an MVRV ratio of -21.37%, Chainlink saw its price rise from $13.08 to $15.62 over a period of time.
These patterns suggest that downturns in the MVRV ratio have historically been followed by periods of price recovery and potential gains for LINK investors.
Chainlink (LINK) Price Outlook and Liquidation Heatmap Analysis
Considering historical trends and current market conditions, signs point to a potential price increase for Chainlink (LINK) in the near term. If this trend continues, LINK could gradually climb towards $17.70 within the next week or two.
In a highly bullish scenario, LINK’s price might even surpass $18.57. However, insights from the liquidation heatmap could challenge this projection.
The liquidation heatmap is a tool used to anticipate significant liquidation events in the market. It highlights areas of high liquidity, often marked in yellow, where price movements may gravitate towards.
According to Coinglass, there is a notable liquidity zone at $15.04 for LINK. This suggests that if the upward momentum falters, LINK’s price could retreat towards this level.
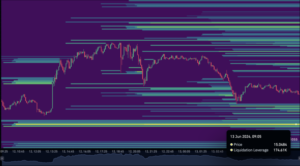
Chainlink Liquidation Heatmap. Source: Coinglass
At this critical point, traders face potential losses amounting to $174,610. To mitigate risks, setting robust stop-loss orders above the identified liquidation zone may be advisable.
Important: Please note that this article is only meant to provide information and should not be taken as legal, tax, investment, financial, or any other type of advice.
Join Cryptos Headlines Community
Follow Cryptos Headlines on Google News