
Bitcoin’s short-term holder activity indicates a possible peak about three weeks ago, while Santiment’s long-term holder metrics suggest caution. The short-term holder realized cap has sharply risen, reflecting a potential top.
It’s unclear whether Bitcoin will drop to around $66k soon or aim for higher liquidity clusters before a correction occurs.
Bitcoin’s Market Cap Changes and Potential Impact on Price
In a post on CryptoQuant Insights, analyst highlighted that the short-term holder (STH) realized market cap change saw a dramatic spike above $10 billion. Analyst noted that increases in STH realized cap of over $6 billion typically occur when holders realize small profits and buyers enter during market tops.
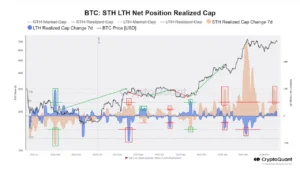
Source: CryptoQuant Insights
While this doesn’t guarantee an immediate dip, historical data since March 2023 shows that spikes above $6 billion in STH realized cap often precede a correction within the next few weeks.
The metric also tracks the realized cap change for long-term holders (LTH) and STH. In March 2024, the LTH 7-day realized cap metric fell below $6 billion, generally indicating profit-taking activity from LTH and potentially marking local tops.
Bitcoin has yet to surpass the all-time high of $73.7k set in March. The recent STH activity could potentially delay the bulls’ efforts to push the price higher.
Bitcoin’s Current Market Indicators and Future Prospects
The mean dollar invested age (MDIA) has been trending upward since mid-March. MDIA calculates the average age of tokens on the network, weighted by their purchase price, and an uptrend is generally seen as a bullish sign. However, when MDIA rises for an extended period, it can indicate network stagnancy due to fewer transactions. Dormant tokens may also signal a lack of new investors entering the market.
Despite the uptrend in MDIA, the MVRV ratio shows that holders are at a healthy profit. Concerns about imminent profit-taking based on this metric do not appear to be significant at this time.
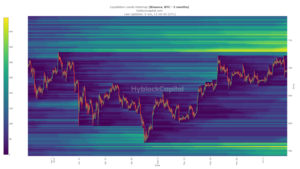
Source: Hyblock
The liquidation heatmap revealed a relative sparsity of liquidation levels below current market prices. Conversely, the $73k-$75k region is dense with short liquidations, suggesting this pool of liquidity might be targeted before any subsequent downward move.
Nearly two months after the halving, Bitcoin’s trend remains unclear. Historically, BTC’s performance in Q3 has been relatively weak, indicating that investors should be prepared for a prolonged and challenging period ahead.
Important: Please note that this article is only meant to provide information and should not be taken as legal, tax, investment, financial, or any other type of advice.
Join Cryptos Headlines Community
Follow Cryptos Headlines on Google News
Author