
Journalist
Posted:
- BTC’s price has been in a consolidation phase during the last few days.
- Most of the on-chain metrics looked bullish on the coin.
After a price rise above $66k, Bitcoin [BTC] once again started to consolidate as the king coin’s price dropped under that mark. However, there was more to the story.
Bitcoin might just be getting ready to retest its all-time high. If things fall into place, then expecting a new ATH wouldn’t be too ambitious.
Bitcoin’s secret plan
The last 24 hours were pretty volatile for the king coin as it witnessed price movements in both directions. But this volatility didn’t allow the coin to break past the $66k psychological resistance again.
In fact, AMBCrypto reported earlier that a bearish divergence appeared on Bitcoin’s price chart, which suggested a price drop. At press time, BTC was trading at $65,692.70.
As per IntoTheBlock’s data, 46.54 million addresses were in profit, which accounted for over 86% of BTC’s total number of BTC addresses.
Nonetheless, AMBCrypto’s analysis revealed an interesting development. We found that BTC successfully tested the bull market support a few days ago. After that, the coin displayed a double bottom pattern.
Whenever that happens, it usually suggests that there were chances of a bull rally. If the pattern tests, then Bitcoin might soon retest its all-time high.
The good news was that a breakout above that level could push the coin towards $80k in the coming weeks.
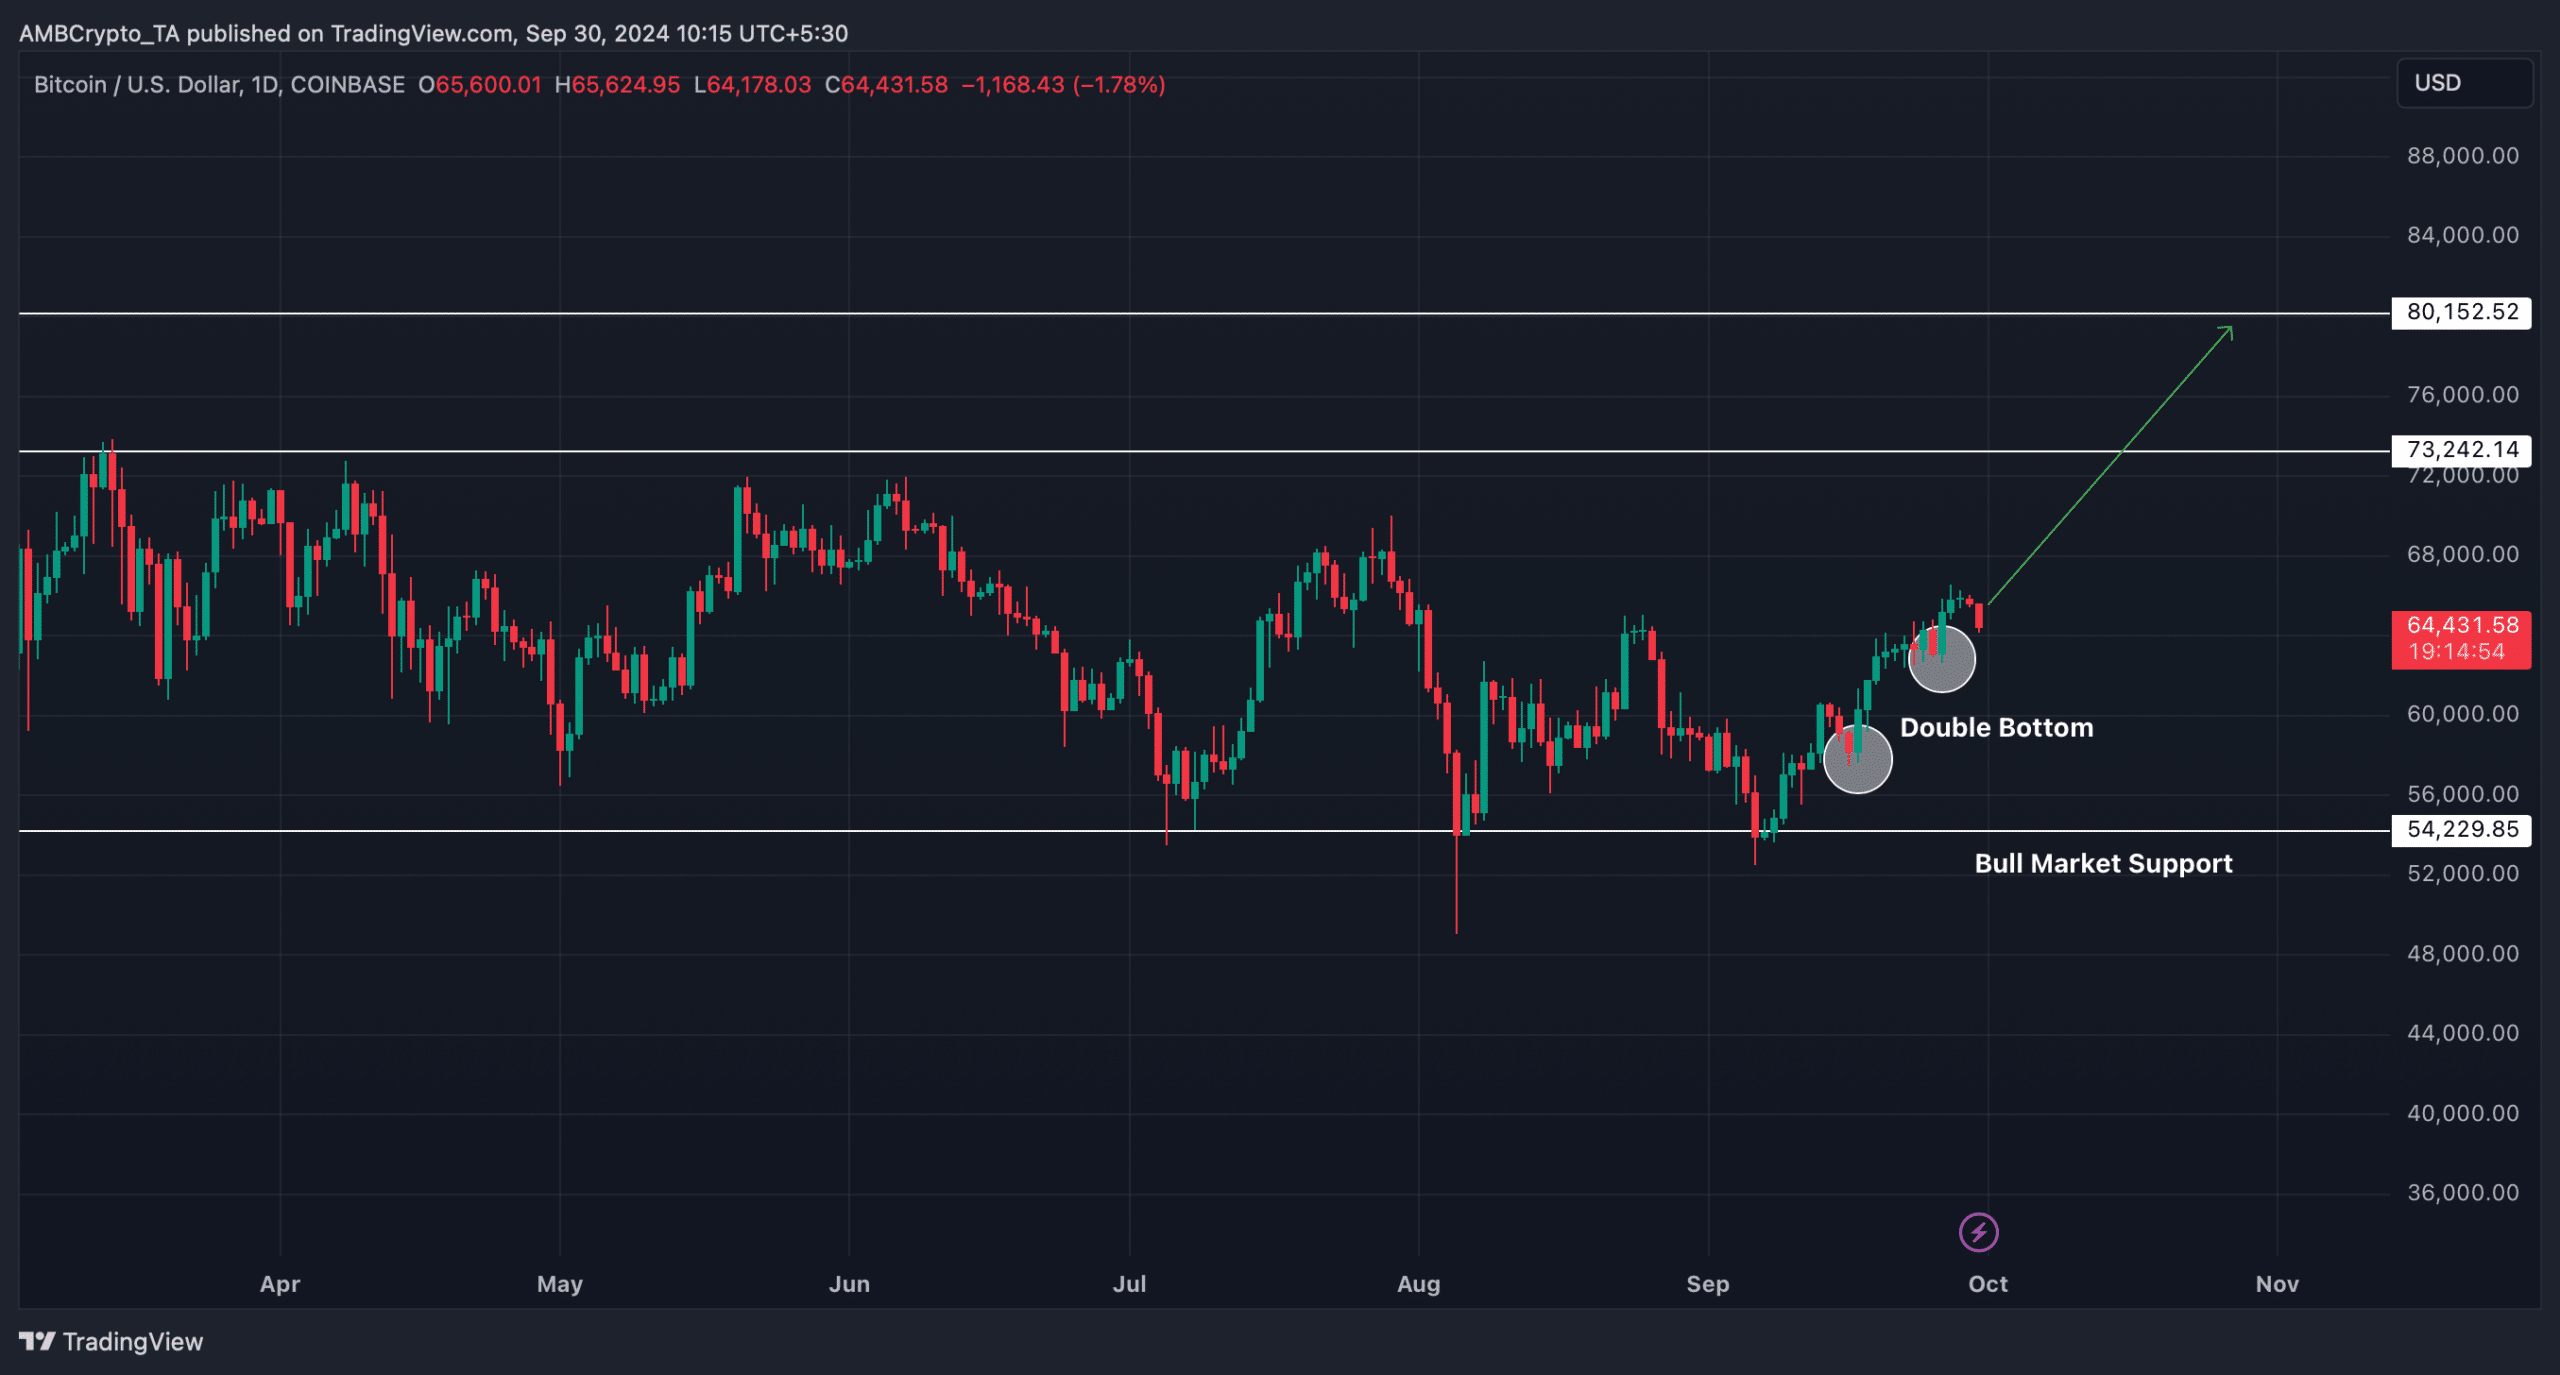
Source: TradingView
Odds of BTC reaching $80k
AMBCrypto then checked the king coin’s on-chain data to see whether they also support the possibility of a price increase.
Our analysis of BTC’s Pi Cycle Top indicator revealed that BTC had finally jumped above its potential market bottom of $61k.
If the metric is to be believed, then this jump could result in BTC touching its possible market top of $110k, which looked a bit ambitious.
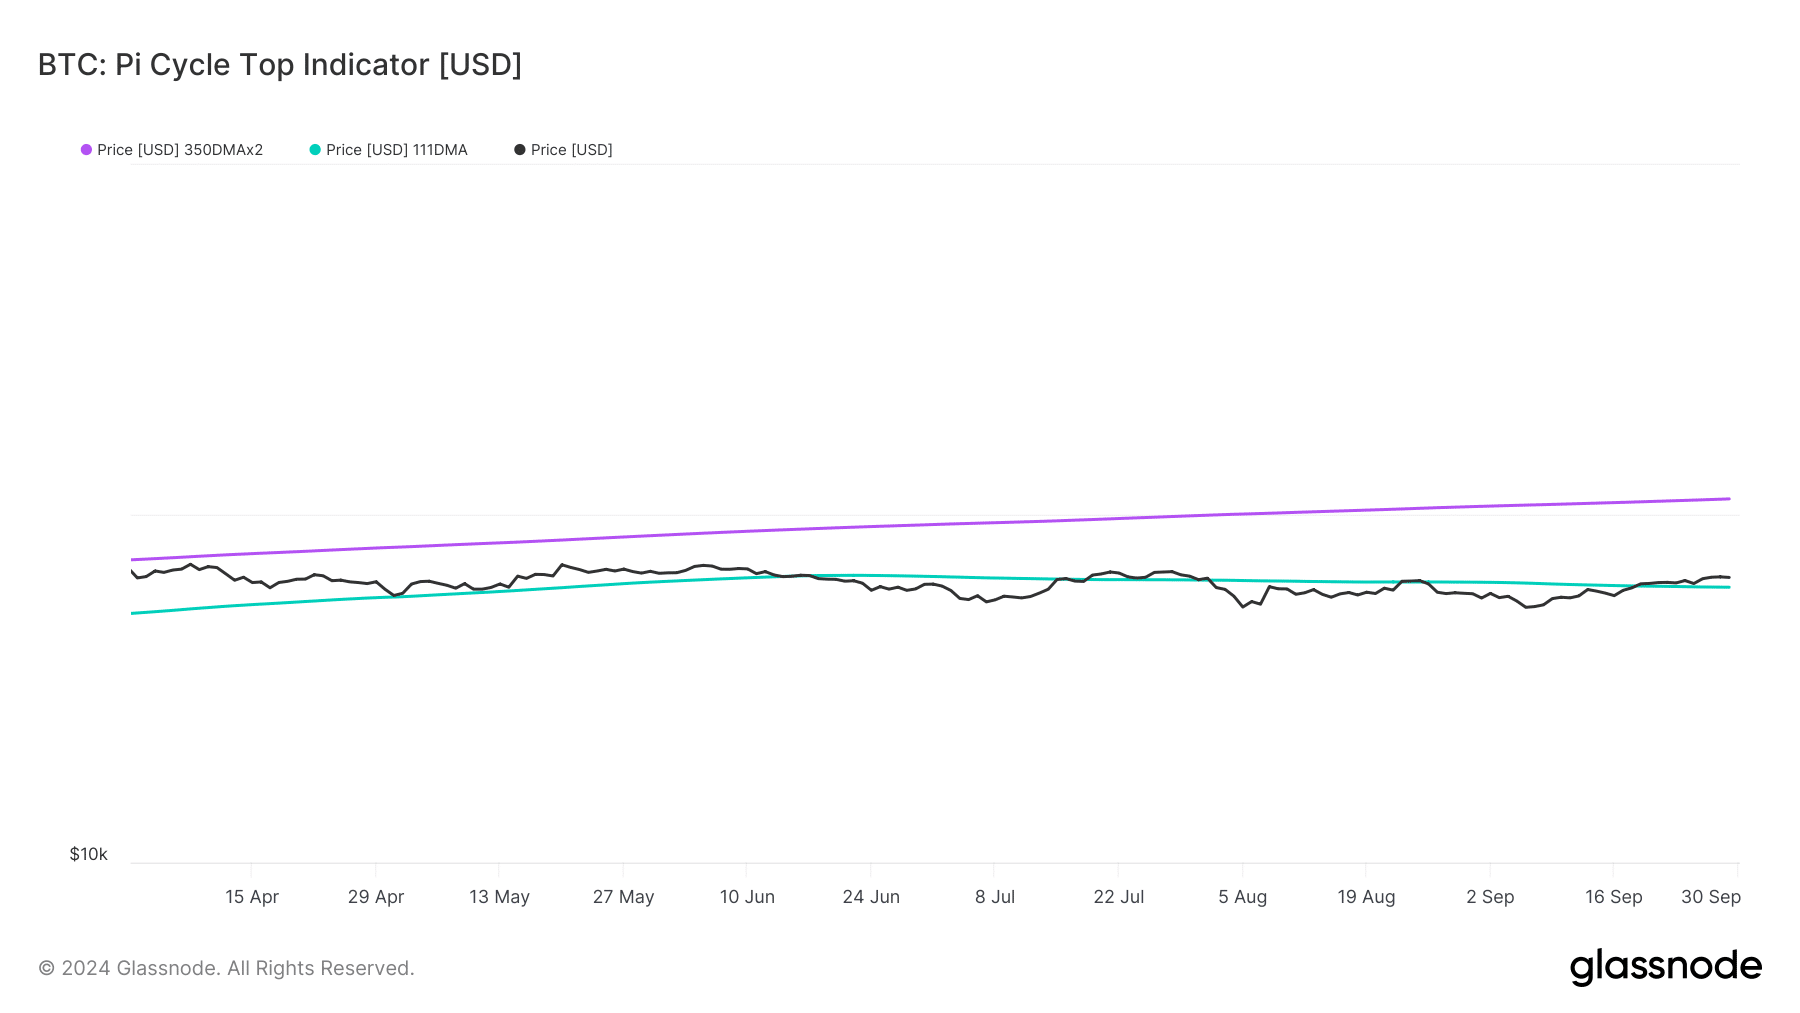
Source: Glassnode
The Bitcoin Rainbow Chart also looked pretty optimistic. BTC’s price was in the “BUY” zone, meaning that this was the right opportunity for investors to accumulate before the coin’s price skyrockets.
Another bullish metric was the long/short ratio as it moved up. A rise in the metric means that there are more long positions in the market than short positions, suggesting a rise in bullish sentiment around an asset.

Source: Coinglass
Is your portfolio green? Check out the BTC Profit Calculator
Since most metrics looked bullish, AMBCrypto checked Hyblock Capital’s data to find out whether there were any resistance levels ahead. We found that a substantial amount of BTC will be liquidated at the $66k mark.
Therefore, it will be crucial for BTC to end its consolidation phase and go above that mark. A jump above $66k could propel the king coin to new highs.

Source: Hyblock Capital