

- The crypto Fear and Greed Index was not overextended in either direction.
- The Tether Dominance chart has been trending higher since April — bulls would want this to change.
The crypto Fear and Greed Index showed that market sentiment was neutral at press time, which was an improvement from early September’s fearful outlook.
The recent correction from $66.5k to $60k has not hurt the market participants too badly.
A recent AMBCrypto report outlined the liquidation pockets around the price that could serve as potential magnet zones. The $66.2k zone is still a resistance and a revisit to this area could rebuff the bulls.
On the other hand, a massive bullish move was possible, based on historical trends.
Where is the crypto market sentiment at
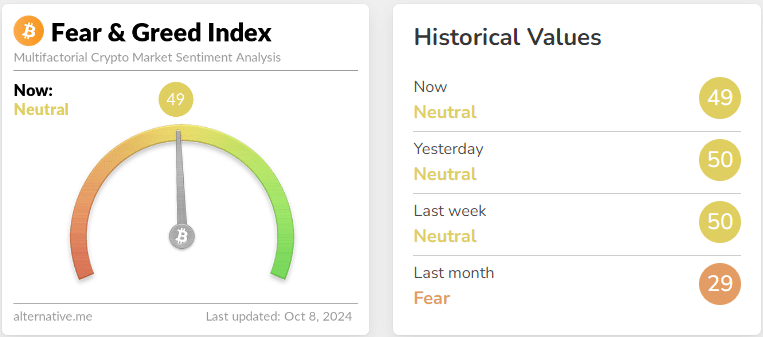
Source: Alternative.me
The helpful Bitcoin Fear and Greed Index chart showed that sentiment was neutral. This was understandable given the price action of the past two weeks.
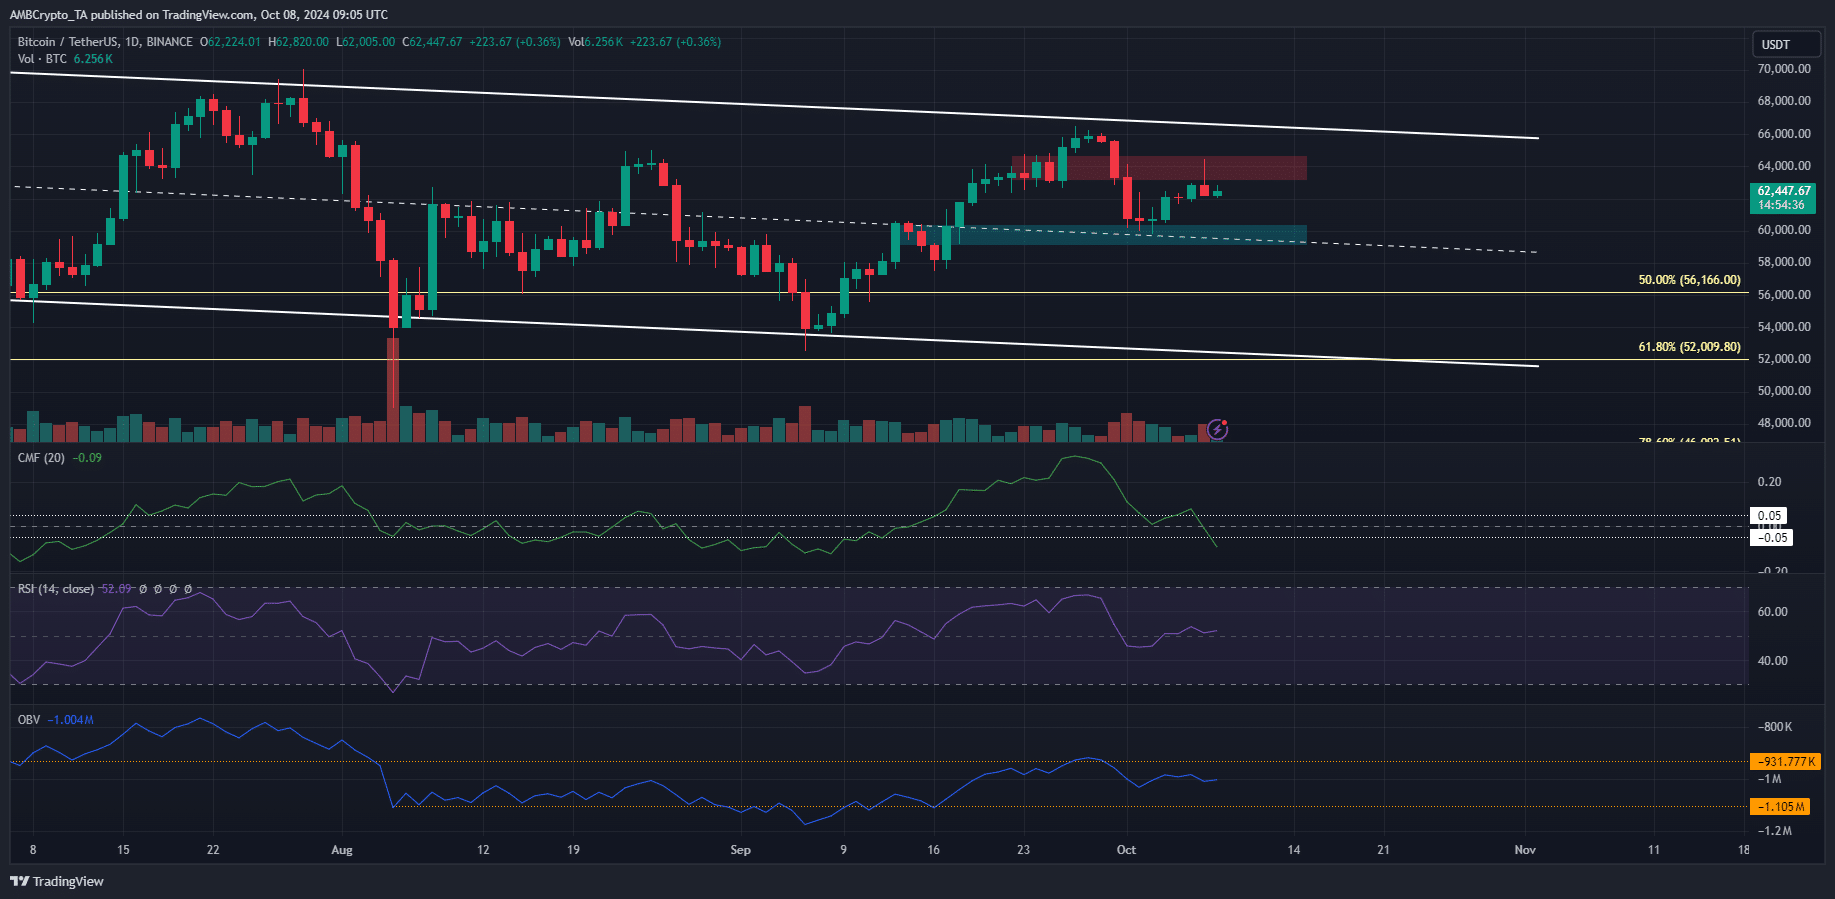
Source: BTC/USDT on TradingView
The descending channel (white) saw its mid-point broken on the 18th of September. A rally nearly reached the channel highs but was rejected. Since then the $64k zone has been flipped to resistance.
The CMF was at -0.09 to show significant capital flow out of the market and firm selling pressure. The OBV also indicated steady selling in the past two weeks, but it has recovered slightly.
The RSI espoused a neutral outlook with its reading of 52.
A drop to the $58k-$60k would present a buying opportunity. A surge beyond $66k-$67k and a retest of the same level as support would also be a chance to go long. The latter scenario is likely to shift market sentiment towards greed.
Findings from the Tether chart for BTC trends
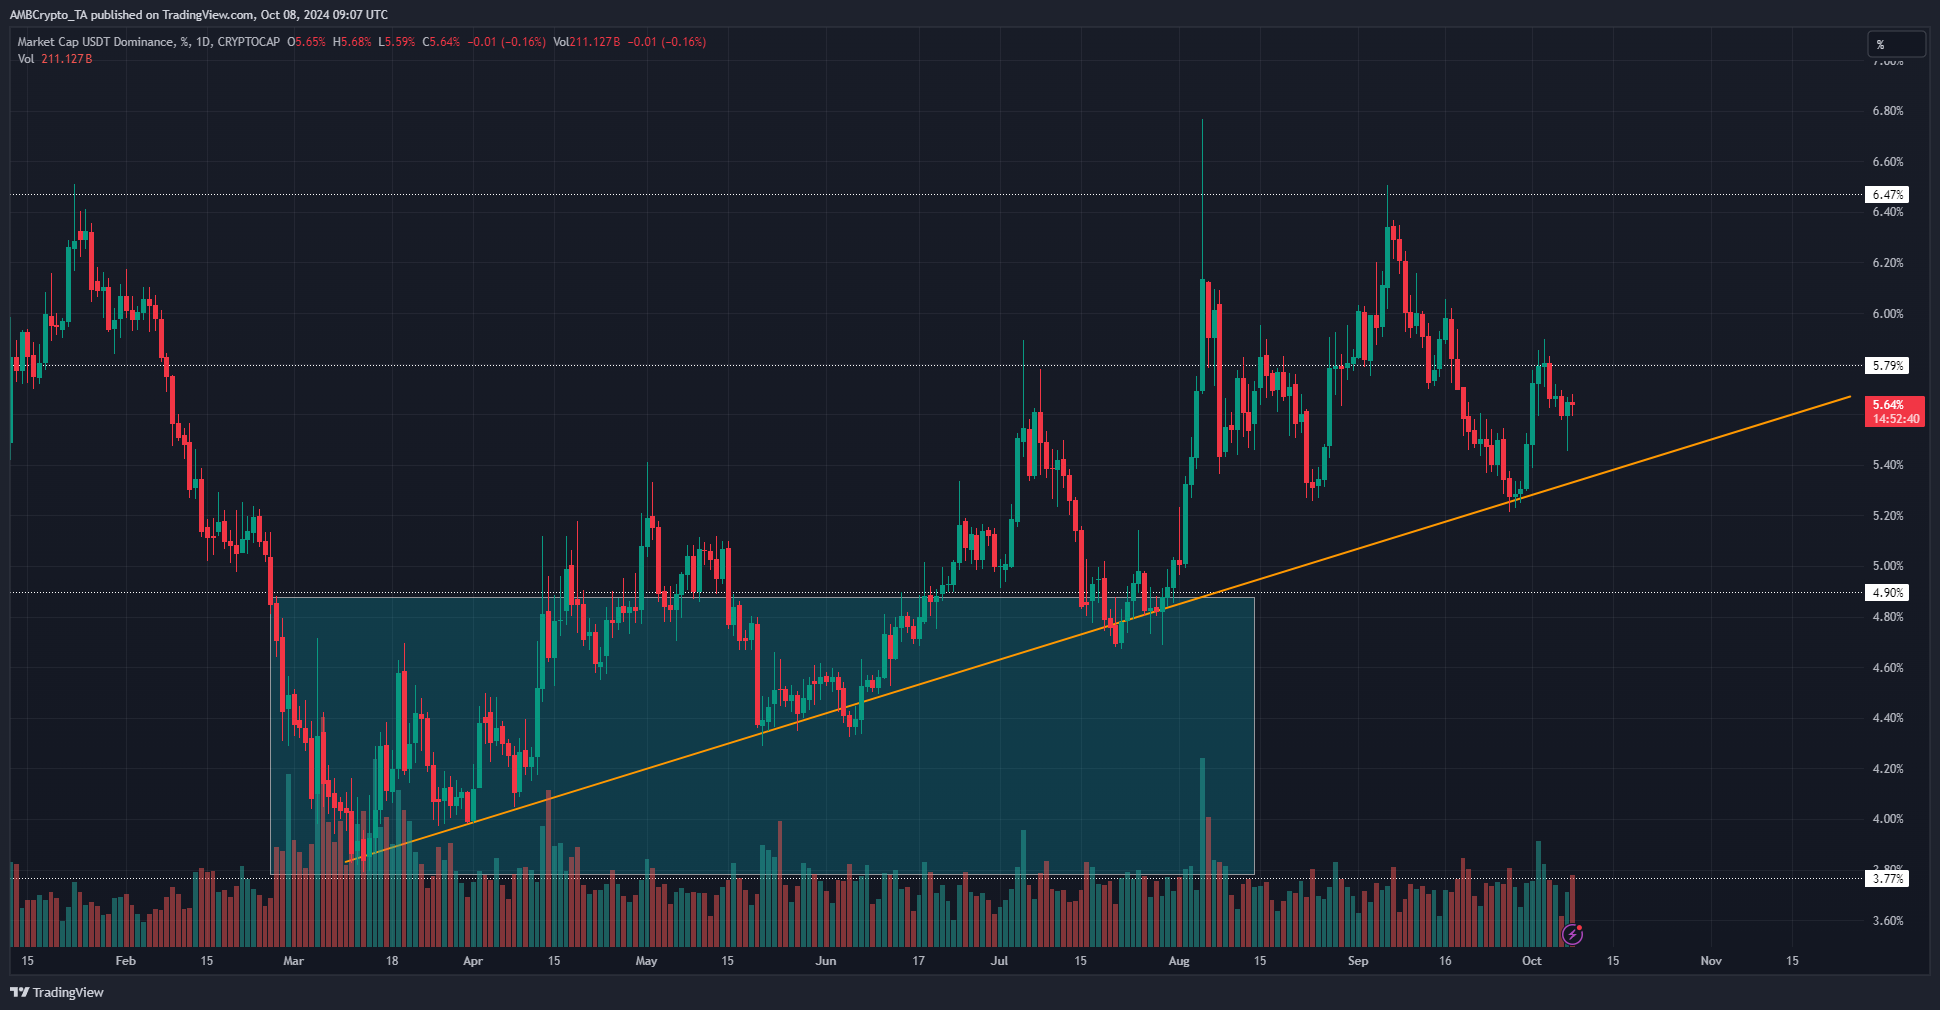
Source: USDT.D on TradingView
The Tether [USDT] dominance trend is inversely related to the crypto market. An uptrend in this metric generally means the market is trending downward, and investors are moving to stablecoins.
The 5.79% level is a resistance level and USDT.D could move further downward in the coming days. A short-term Bitcoin rally is possible.
Is your portfolio green? Check out the BTC Profit Calculator
However, the metric has trended upward since March, as captured by the ascending trendline.
Until it is broken, investors and swing traders across the crypto market need to be conservative with their bullish targets.
Disclaimer: The information presented does not constitute financial, investment, trading, or other types of advice and is solely the writer’s opinion