Bitcoin (BTC), with a current price of $37,584, successfully surpassed the significant barrier at $38,000 on November 24, signaling a positive sentiment in the market. Analysts are optimistic about the next two years, anticipating a favorable market environment.
The upcoming catalysts include the Bitcoin halving scheduled for April and pending applications for a spot Bitcoin exchange-traded fund (ETF). These events, especially the ETF decisions in January, are expected to drive increased market activity. The prevailing outlook suggests that Bitcoin is poised to attract buyers during any price dips.
Crypto Traders Monitor Resistance Amid ARK’s GBTC Sales
Analysts are anticipating a potential retracement from the $40,000 level in the near term, prompting cautious moves from major players like ARK Invest. Cathie Wood’s investment firm has gradually divested around 700,000 shares of the Grayscale Bitcoin Trust (GBTC) over the past month. However, it’s noteworthy that ARK still holds over 4.3 million GBTC shares.

Daily cryptocurrency market performance. Source: Coin360
Amidst this backdrop, crypto traders are assessing the possibility of breaking through overhead resistance levels in Bitcoin and major altcoins. In this analysis, we’ll delve into the charts of the top 10 cryptocurrencies to identify crucial levels and potential market dynamics.
Cryptocurrency Market Analysis: Bulls and Bears in Battle
1. Bitcoin Price Analysis

BTC/USDT daily chart. Source: TradingView
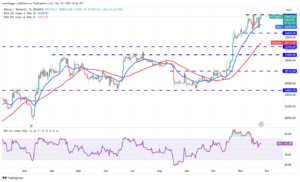
Bitcoin managed to break the $37,980 resistance on Nov. 24, but sustaining the breakout has been challenging. The current battle suggests strong resistance at this level. With upward-sloping moving averages and RSI above 61, the path of least resistance seems upward. Maintaining above $37,980 could propel BTC to $40,000. However, a failure may lead to a downward trend, with a critical support at $34,800.
2. Ether Price Analysis

ETH/USDT daily chart. Source: TradingView
Ether breached $2,086 resistance on Nov. 22, signaling a potential up-move. Attempts to pull it below the resistance were unsuccessful, indicating bulls’ effort to turn it into support. If successful, ETH may head to $2,200, and a breakthrough could open gates to $3,400. A drop below $1,900 could invalidate this bullish outlook.
3. BNB Price Analysis

BNB/USDT daily chart. Source: TradingView
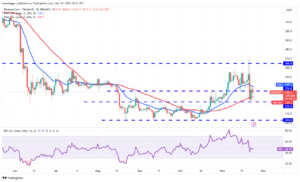
BNB jumped above $235 on Nov. 22 but faced resistance at the 20-day EMA ($239), suggesting bear control. The 20-day EMA is turning down, and RSI is below the midpoint, favoring bears. A close below $223 might lead to a fall to $203. Staying above the 20-day EMA could keep BNB in a range between $223 and $265.
4. XRP Price Analysis

XRP/USDT daily chart. Source: TradingView
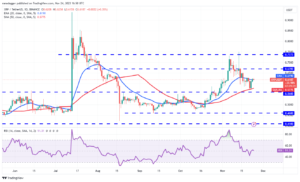
XRP attempts to rise above the 20-day EMA ($0.62), indicating buying at lower levels. The RSI near the midpoint suggests short-term range-bound action. XRP may swing between $0.56 and $0.74. Sustaining above the 20-day EMA could lead to $0.67 and $0.74. A drop below $0.56 may signal a sharper correction to $0.46.
5. Solana Price Analysis

SOL/USDT daily chart. Source: TradingView
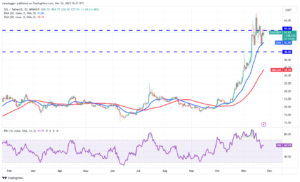
Solana has been testing $59 resistance but faces resistance from bears. The 20-day EMA and positive RSI favor bulls. A breakout could take SOL to $68, but a downturn may test $48, where buyers may step in.
6. Cardano Price Analysis

ADA/USDT daily chart. Source: TradingView
Cardano fluctuates around $0.38, showing uncertainty. Upsloping moving averages and positive RSI give a slight bullish edge. A rise above $0.40 could start an up-move to $0.46, while a fall below $0.34 may lead to $0.31.
7. Dogecoin Price Analysis

DOGE/USDT daily chart. Source: TradingView
Dogecoin maintains above the 20-day EMA ($0.08), but the rise lacks momentum. Staying above $0.08 could propel DOGE to $0.10, but a downturn might test $0.07.
8. Toncoin Price Analysis

TON/USDT daily chart. Source: TradingView
Toncoin aims for the $2.59 resistance, with repeated tests weakening it. A sustained breakout may lead to an uptrend targeting $3.28 and $4.03. A downturn may test the 50-day SMA ($2.20).
9. Chainlink Price Analysis

LINK/USDT daily chart. Source: TradingView
Chainlink faces selling at the downtrend line but hasn’t given up. Trapped between the downtrend line and 61.8% Fibonacci retracement, a sharp move is likely. A surge above the downtrend may target $16.60 and $18.30, while a drop below $12.83 could lead to $11.21.
10. Avalanche Price Analysis

LINK/USDT daily chart. Source: TradingView
Avalanche reached $22 resistance, and bears are expected to defend. Sustaining above $22 could lead to $25, while a downturn below the 20-day EMA ($18.40) might indicate a correction to $16. The range between $10.50 and $22 might persist.
If the current level holds strong without significant retracement, there’s an increased chance of breaking above $22 for the AVAX/USDT pair. A potential climb to $25 might encounter robust resistance from bears.
On the flip side, closely monitor the 20-day EMA at $18.40. If the price declines below this level, it signals the beginning of a more substantial correction, possibly down to $16. This movement would suggest an extended period of fluctuation for the AVAX/USDT pair within the broad range of $10.50 to $22.
Important: Please note that this article is only meant to provide information and should not be taken as legal, tax, investment, financial, or any other type of advice.
Join Cryptos Headlines Community
Follow Cryptos Headlines on Google News


