- Dogecoin has continued to see a positive funding rate despite its decline.
- Price has dropped by almost 5% as of this report.
Dogecoin’s recent price action has been dramatic, with the popular meme coin surging to one of its highest points in the last month before experiencing a sharp reversal. This volatility has left investors questioning how low the asset might drop if this bearish trend continues.
Analyzing DOGE’s price trend, the NVT (Network Value to Transaction) ratio, and overall market sentiment provides some insight into the potential direction of the coin in the coming days.
Price trend signals possible downtrend for Dogecoin
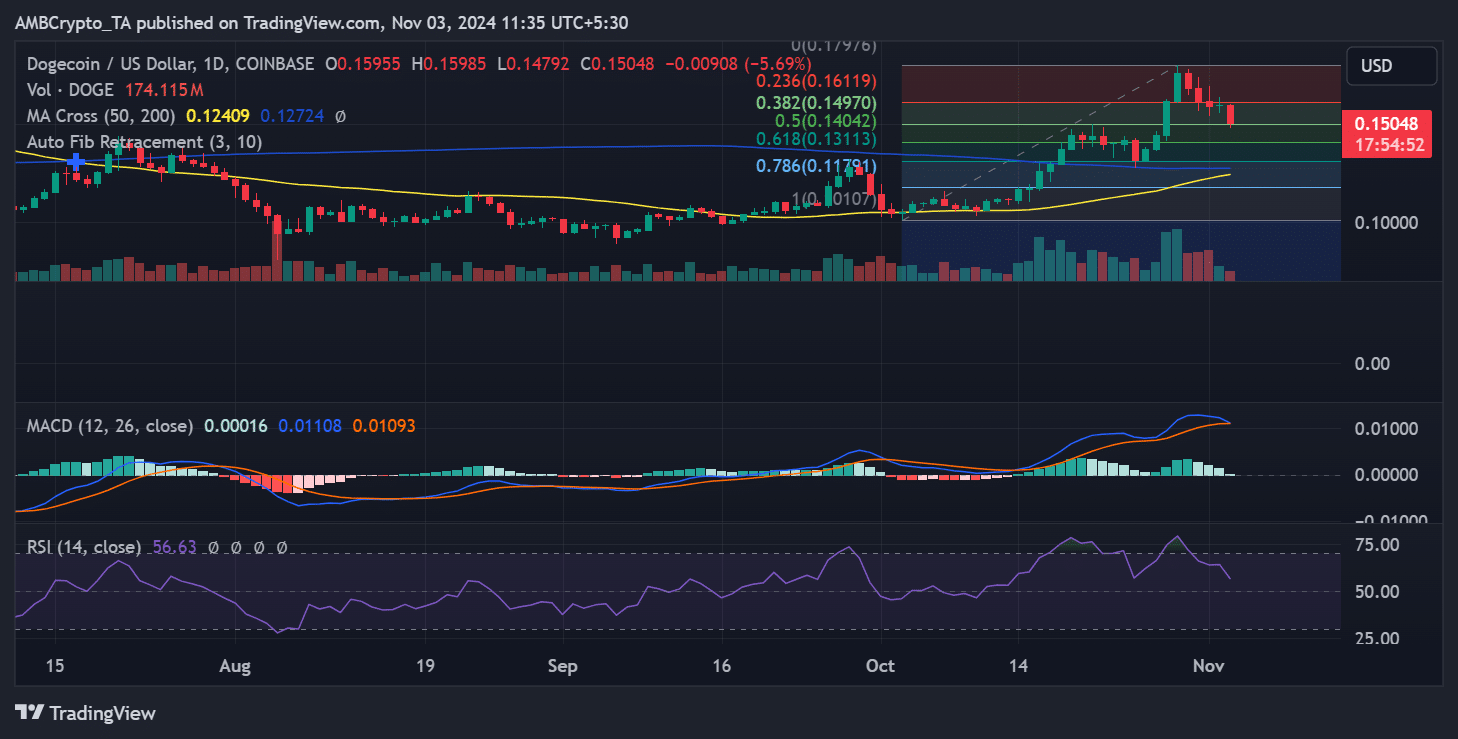
Dogecoin’s price chart shows a noticeable downtrend after its recent peak.
Following the bullish run that pushed it to a high of $0.17976, the asset has fallen back, trading near $0.15048 at the time of writing. This drop is accompanied by declining trading volume, suggesting that buying momentum has weakened.
The MACD indicator, which had recently shown bullish momentum, has started to flatten, indicating a potential shift toward bearish dominance.
The RSI also hovers near the 56.63 mark, shifting from overbought levels. If this trend continues, Dogecoin could test the key support levels at the 0.382 ($0.14970) and 0.5 ($0.14042) Fibonacci retracement levels.
Rising NVT ratio hints at potential Dogecoin overvaluation
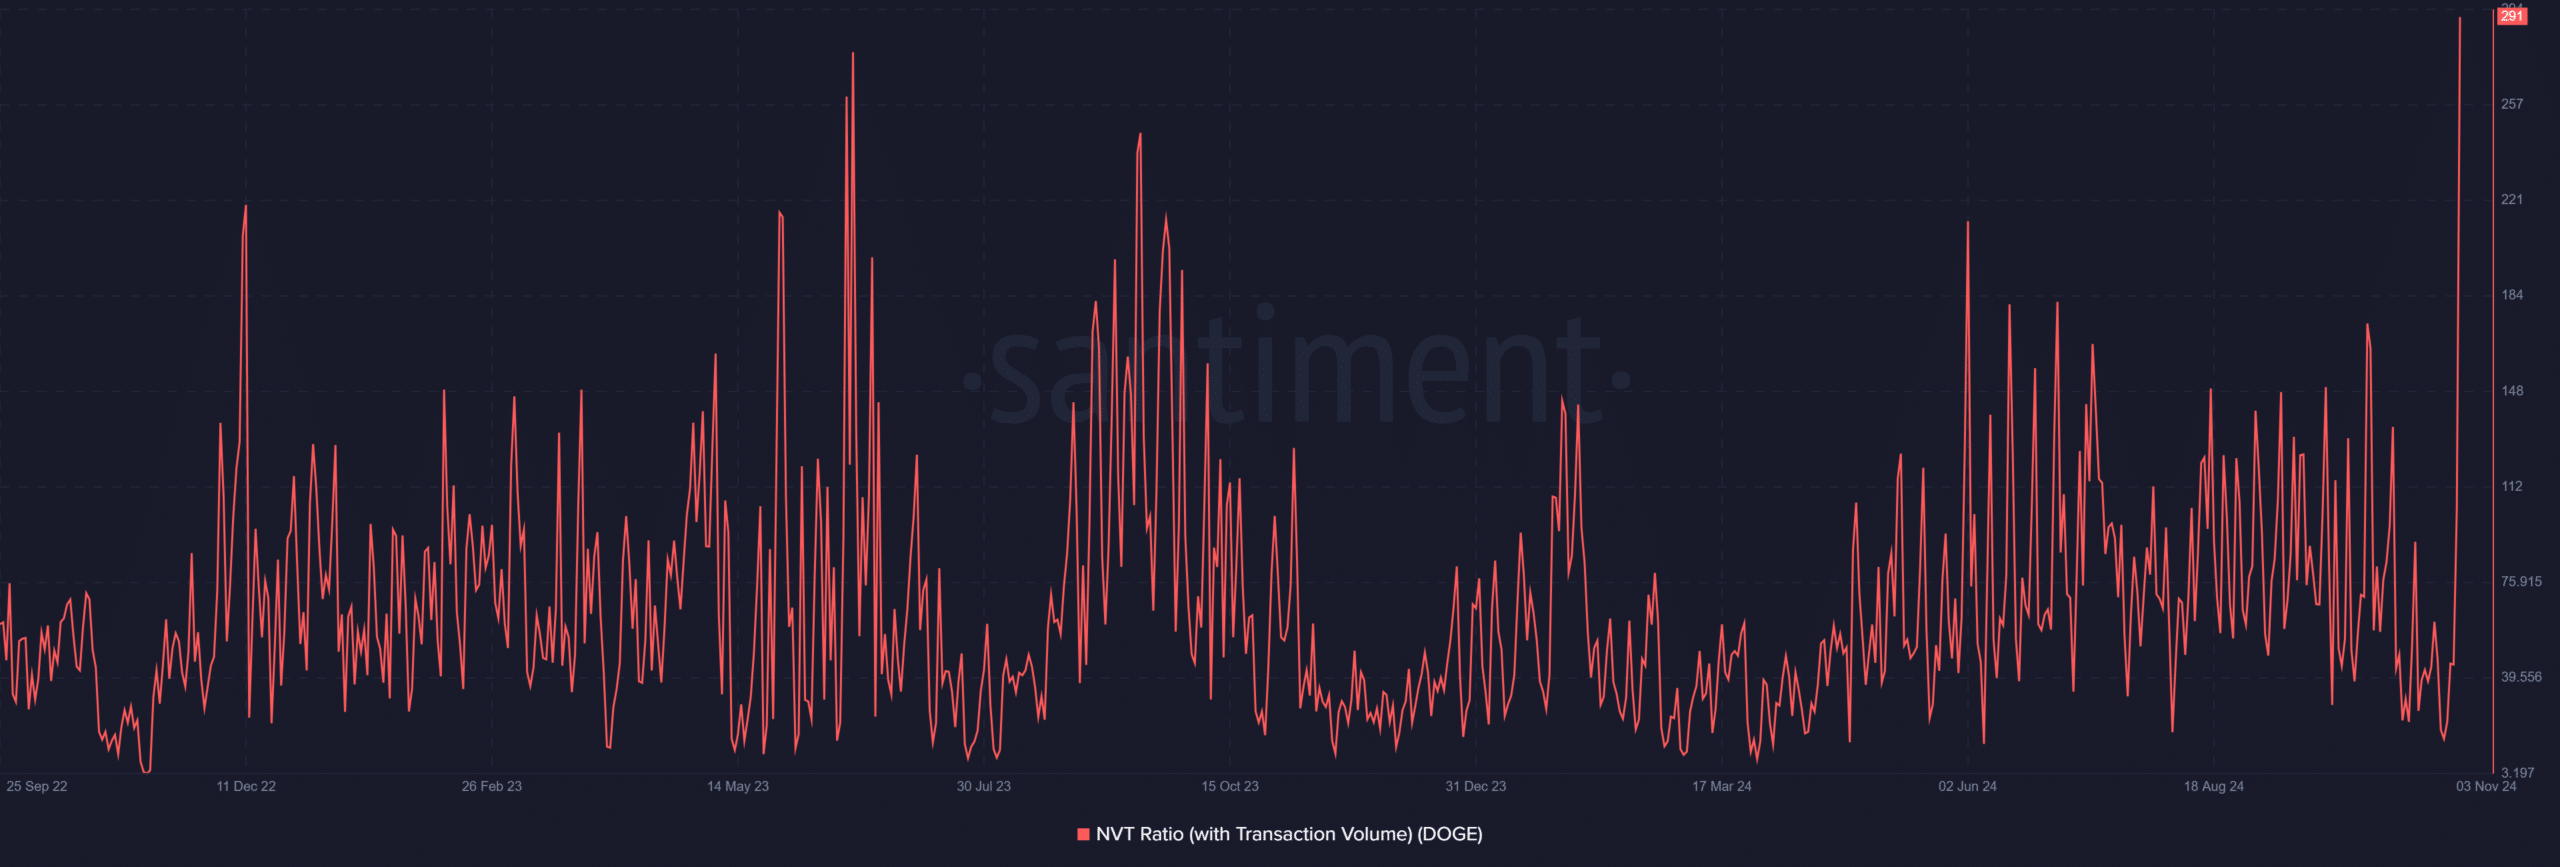
The Network Value to Transaction (NVT) ratio for Dogecoin has also been a crucial metric to observe. Historically, Dogecoin’s NVT ratio has had peaks and valleys, with higher peaks often correlating to market sell-offs.
The recent spike in the NVT ratio indicates a possible overvaluation relative to the current transaction volume, which could signal a further price correction.
A high NVT ratio can reflect an increased valuation without a corresponding rise in transaction volume, potentially highlighting investor speculation rather than organic network usage.
If this indicator continues to rise, it may suggest further downside risks for Dogecoin.
Key levels to watch amidst bearish sentiment
In addition to the support levels mentioned, traders are likely keeping a close eye on the 50-day and 200-day moving averages for Dogecoin, which sit around $0.12409 and $0.12724, respectively.
A breakdown below these averages could trigger additional selling pressure, pushing DOGE to revisit the $0.12 range. Conversely, if DOGE can stabilize around the $0.15 level, it may signal that the recent downtrend is nearing exhaustion.
Is your portfolio green? Check out the Dogecoin Profit Calculator
However, with the current market sentiment and the heightened NVT ratio, the downside appears more likely in the short term.
Dogecoin’s recent price trend and elevated NVT ratio suggest a challenging road ahead. If bearish sentiment persists, Dogecoin may retest lower support levels before finding a stable ground.


