Dogecoin is trying to bounce back above the $0.150 mark against the US Dollar. However, it might face difficulty breaking through the $0.170 barrier.
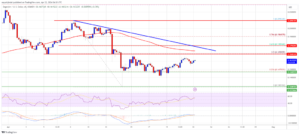
DOGE began recovering from the $0.1280 support against the US dollar. It’s now above $0.1500 and the 100 simple moving average (4 hours). On the 4-hour chart of the DOGE/USD pair (data from Kraken), a crucial bearish trend line is forming with resistance at $0.170. For a positive shift and a new upward trend, the price needs to close above $0.170.
Dogecoin Price Analysis: Recovery Challenges Ahead
After experiencing a significant drop, Dogecoin found support at $0.1280, forming a low at $0.1283. Following suit with Bitcoin and Ethereum, DOGE initiated a notable recovery, surpassing resistance levels at $0.1350 and $0.140.
Despite climbing above the 23.6% Fibonacci retracement level of the downward movement from the $0.2093 high to the $0.1283 low, bears remain active, hindering further gains. Additionally, a crucial bearish trend line is forming with resistance at $0.170 on the 4-hour DOGE/USD chart.

Source: DOGEUSD on TradingView.com
Presently, Dogecoin is trading below the $0.1650 level and the 100 simple moving average (4 hours). Resistance lies near $0.1690, representing the 50% Fibonacci retracement level. The next significant barrier is at $0.170, with a breakthrough possibly propelling the price toward resistance at $0.1880. Subsequent resistance levels stand at $0.200 and $0.220, should the uptrend persist.
Dogecoin Price Forecast: Potential Support and Resistance Levels
If Dogecoin fails to accelerate above the $0.170 mark, it could signal another downward trend. Initial support is anticipated around the $0.1525 level, followed by a more significant support near $0.1475. Should the price break below the $0.1475 support, further decline is possible, potentially targeting the $0.1280 level.
On the positive side, the 4-hour MACD for DOGE/USD is showing bullish momentum, while the 4-hour RSI is above the 50 level, indicating strength in the market.
Key Levels to Watch
Support: $0.1525, $0.1475, $0.1280
Resistance: $0.1690, $0.1700, $0.200
Important: Please note that this article is only meant to provide information and should not be taken as legal, tax, investment, financial, or any other type of advice.
Join Cryptos Headlines Community
Follow Cryptos Headlines on Google News


