


The price of Ethereum is holding steady above the $2,575 support level, indicating a period of consolidation. If Ethereum manages to break through the $2,700 resistance barrier, it could initiate a significant upward movement.
Currently, Ethereum is trading above $2,620 and the 100-hourly Simple Moving Average. On the hourly chart of ETH/USD, there’s a short-term breakout pattern forming, with resistance around $2,640. For Ethereum to potentially see further gains, it needs to maintain its position above the $2,575 support zone.
Ethereum Price Analysis: Upside Momentum and Key Levels
Ethereum saw a surge above the $2,600 mark, nearing the crucial $2,700 resistance zone, with ETH hitting as high as $2,681 before encountering a downward correction.
Following the upward move, Ethereum experienced a dip below $2,640 and $2,620 levels. This decline breached the 23.6% Fibonacci retracement level of the recent swing from the $2,472 low to the $2,681 high. However, support was found near the $2,600 area, where bullish activity emerged.
Ethereum has found support at $2,600 and is now striving for another upward move. It is currently trading above $2,620 and the 100-hourly Simple Moving Average.
Immediate resistance is anticipated around the $2,640 level, with a short-term breakout pattern forming on the hourly ETH/USD chart. The first significant resistance lies near $2,680, followed by a major hurdle at $2,720. Surpassing this level could pave the way for a test of the $2,800 resistance.
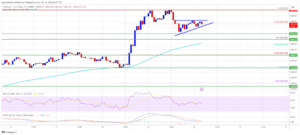
Source: ETHUSD on TradingView.com
Continued bullish momentum may lead to Ethereum breaking above the $2,800 resistance. In such a scenario, the price could target the $3,000 level as its next significant milestone.
Ethereum Price Outlook: Potential Decline and Critical Support Levels
If Ethereum encounters difficulty surpassing the $2,640 resistance, there’s a possibility of a new downward trend. Initial support is expected around the $2,620 mark.
The next crucial support level to monitor is around $2,600. A decisive drop below this could lead to further decline, potentially targeting $2,575 or the 50% Fibonacci retracement level of the recent move from the $2,472 low to the $2,681 high. The primary support zone stands at $2,550 or the 100 hourly Simple Moving Average (SMA). Extended losses might drive the price towards the $2,440 level.
Technical Indicators and Momentum
The Hourly Moving Average Convergence Divergence (MACD) for ETH/USD indicates gaining bullish momentum. Additionally, the Hourly Relative Strength Index (RSI) is currently above the 50 level, suggesting positive market sentiment.
In summary, the major support level is identified at $2,600, while the primary resistance level is marked at $2,640. Monitoring these levels will provide insights into potential price movements in the near term.
Important: Please note that this article is only meant to provide information and should not be taken as legal, tax, investment, financial, or any other type of advice.
Join Cryptos Headlines Community
Follow Cryptos Headlines on Google News
Author