


In the last 24 hours, the price of Ethereum (ETH) increased by more than 3.6%, reaching $1,893.51. Notably, just before this surge, a significant player withdrew $16 million worth of ETH after depositing 31.8 million USDT on Binance. The technical indicators on ETH’s daily chart also indicated the potential for its price to continue rising in the next 24-48 hours.

In the last 24 hours, Ethereum (ETH) experienced a notable surge, with its price increasing by more than 3.6%, according to CoinMarketCap. As a result, the leading altcoin was trading at $1,893.51 at the time of reporting. This 24-hour gain also contributed to ETH’s weekly performance, with a positive increase of +6.49%.
Whale Transactions Impacting ETH
One potential reason for Ethereum’s strong performance in recent trading hours might be related to significant transactions by a particular whale. As reported by the on-chain tracking platform Lookonchain in a recent post, a whale withdrew 8,618 ETH, valued at $16 million, from Binance in the past 12 hours. This move could have played a role in influencing ETH’s price dynamics.
This smart whale withdrew another 8,618 $ETH ($16M) from #Binance 4 hours ago.
The whale deposited 31.8M $USDT to #Binance and withdrew 17,316 $ETH, the buying price is ~$1,836.https://t.co/OLrmsm7kAi pic.twitter.com/WHvgeaR5At
— Lookonchain (@lookonchain) November 5, 2023
The same whale made notable moves with ETH, first depositing 31.8 million USDT into Binance and subsequently withdrawing 17,317 ETH. Lookonchain reported that the average buying price for these transactions was $1,836.
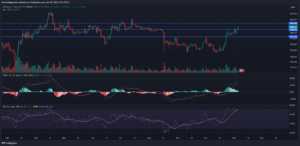
Daily chart for ETH/USDT (Source: TradingView)
Technical Perspective: ETH’s Resistance and Support Levels
From a technical standpoint, Ethereum (ETH) managed to surpass the $1,850 resistance level in recent trading hours. If it can close today’s daily candle above this point, it may attempt to challenge the next resistance at $1,945 in the coming days.
However, if today’s daily candle closes below $1,850, ETH’s price could be at risk of correcting down to the next critical support level at $1,747 in the short term.
Bullish Indicators
Notably, technical indicators are currently favoring a bullish scenario. The daily Relative Strength Index (RSI) line, positioned above the RSI Simple Moving Average (SMA) line, suggests that buyers have gained an advantage on ETH’s daily chart. This shift occurred after the two lines crossed, indicating buyer strength against bears.
Furthermore, the daily Moving Average Convergence Divergence (MACD) indicator is also showing a bullish signal. With the MACD line positioned above the MACD Signal line, it suggests that Ethereum’s bullish trend may continue in the coming days.
Important: Please note that this article is only meant to provide information and should not be taken as legal, tax, investment, financial, or any other type of advice.
Join Cryptos Headlines Community
Follow Cryptos Headlines on Google News
Author