

The Fantom (FTM) price has recently shown promising growth, but questions remain about how long this uptrend can last. Despite the initial surge, key indicators are starting to hint at a potential weakening of momentum. ADX values have declined, suggesting that the strong bullish trend may be losing steam.
Additionally, while the recent drop in exchange supply provided a boost, subsequent stability in this metric raises doubts about continued upward pressure. The coming days will be crucial in determining whether FTM can sustain its gains or face a reversal towards lower support levels.
Fantom Price Current Trend May Not Last
FTM’s ADX is currently at 28.85, down from 32 just a day ago. This comes after a rapid surge where the ADX rose from 15 to 32 in just two days, reflecting a strong and swift increase in trend strength.
However, the recent decline indicates that the momentum may be losing some of its force, and traders are paying close attention to see if this trend continues downward.
Read more: Fantom (FTM) Price Prediction 2024/2025/2030
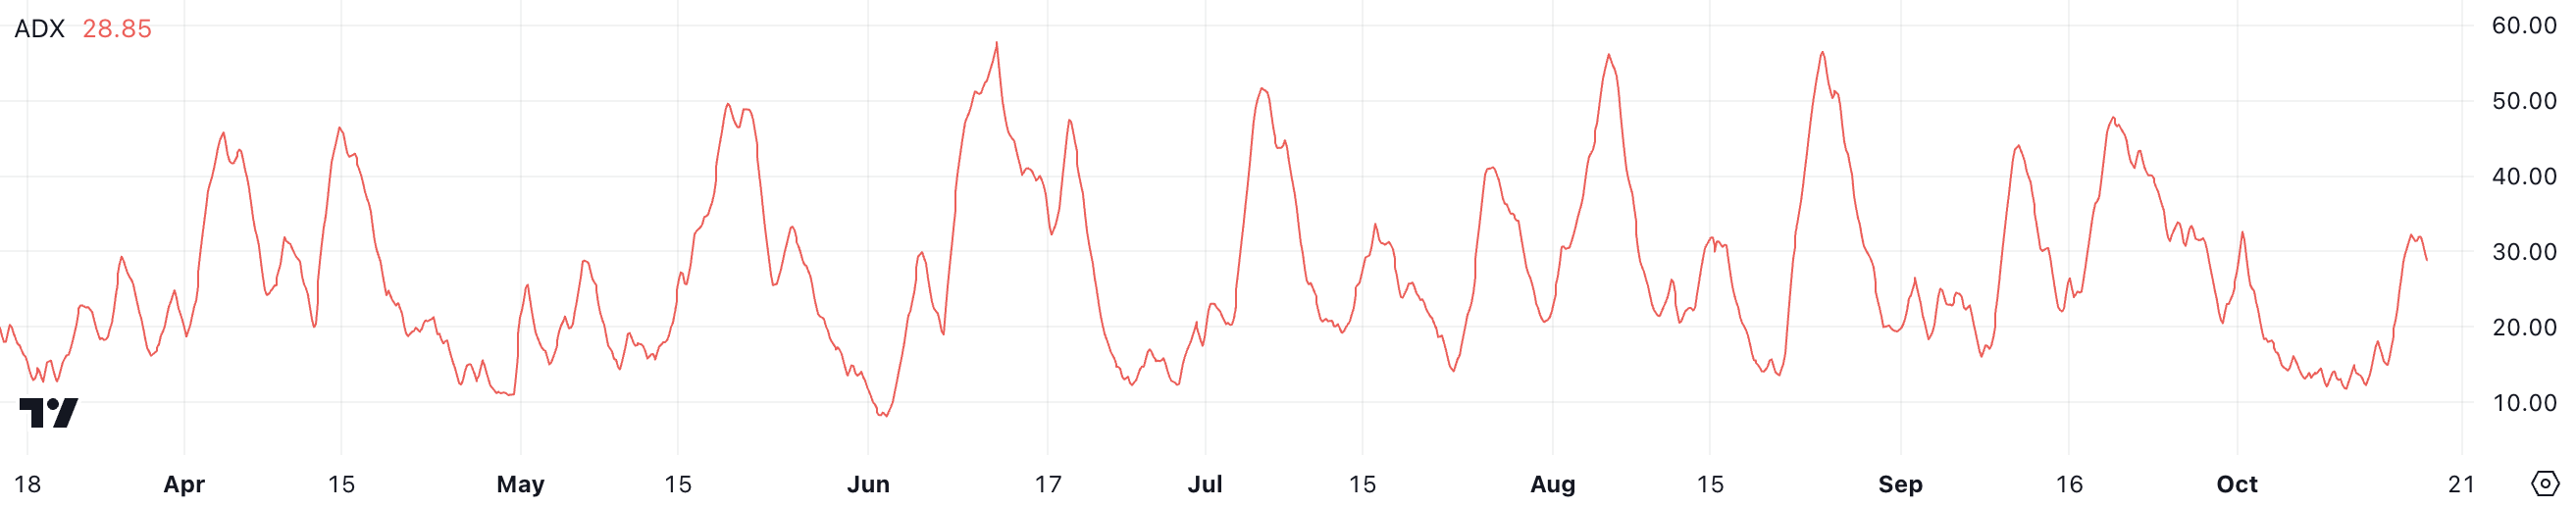
The ADX, or Average Directional Index, measures the strength of a trend, regardless of whether it is bullish or bearish. It ranges from 0 to 100, with values above 20 indicating a trending market and anything above 30 signifying a strong trend. FTM’s price surged by 14% in the past seven days, driven by this strong uptrend.
However, the fact that the ADX has decreased from above the 30 threshold suggests that the current upward momentum might be weakening. If the ADX continues to fall, it could imply that the trend is losing strength, potentially signaling an end to the recent bullish rally.
FTM Supply On Exchanges Dropped Heavily Before the Recent Surge
Between October 13 and October 14, FTM’s supply on exchanges dropped from 712 million to 688 million. This coincided with a price increase, with FTM rising from $0.66 on October 13 to $0.78 by October 15.
The reduction in exchange supply suggests that fewer tokens were readily available for selling, aligning with the subsequent price surge.
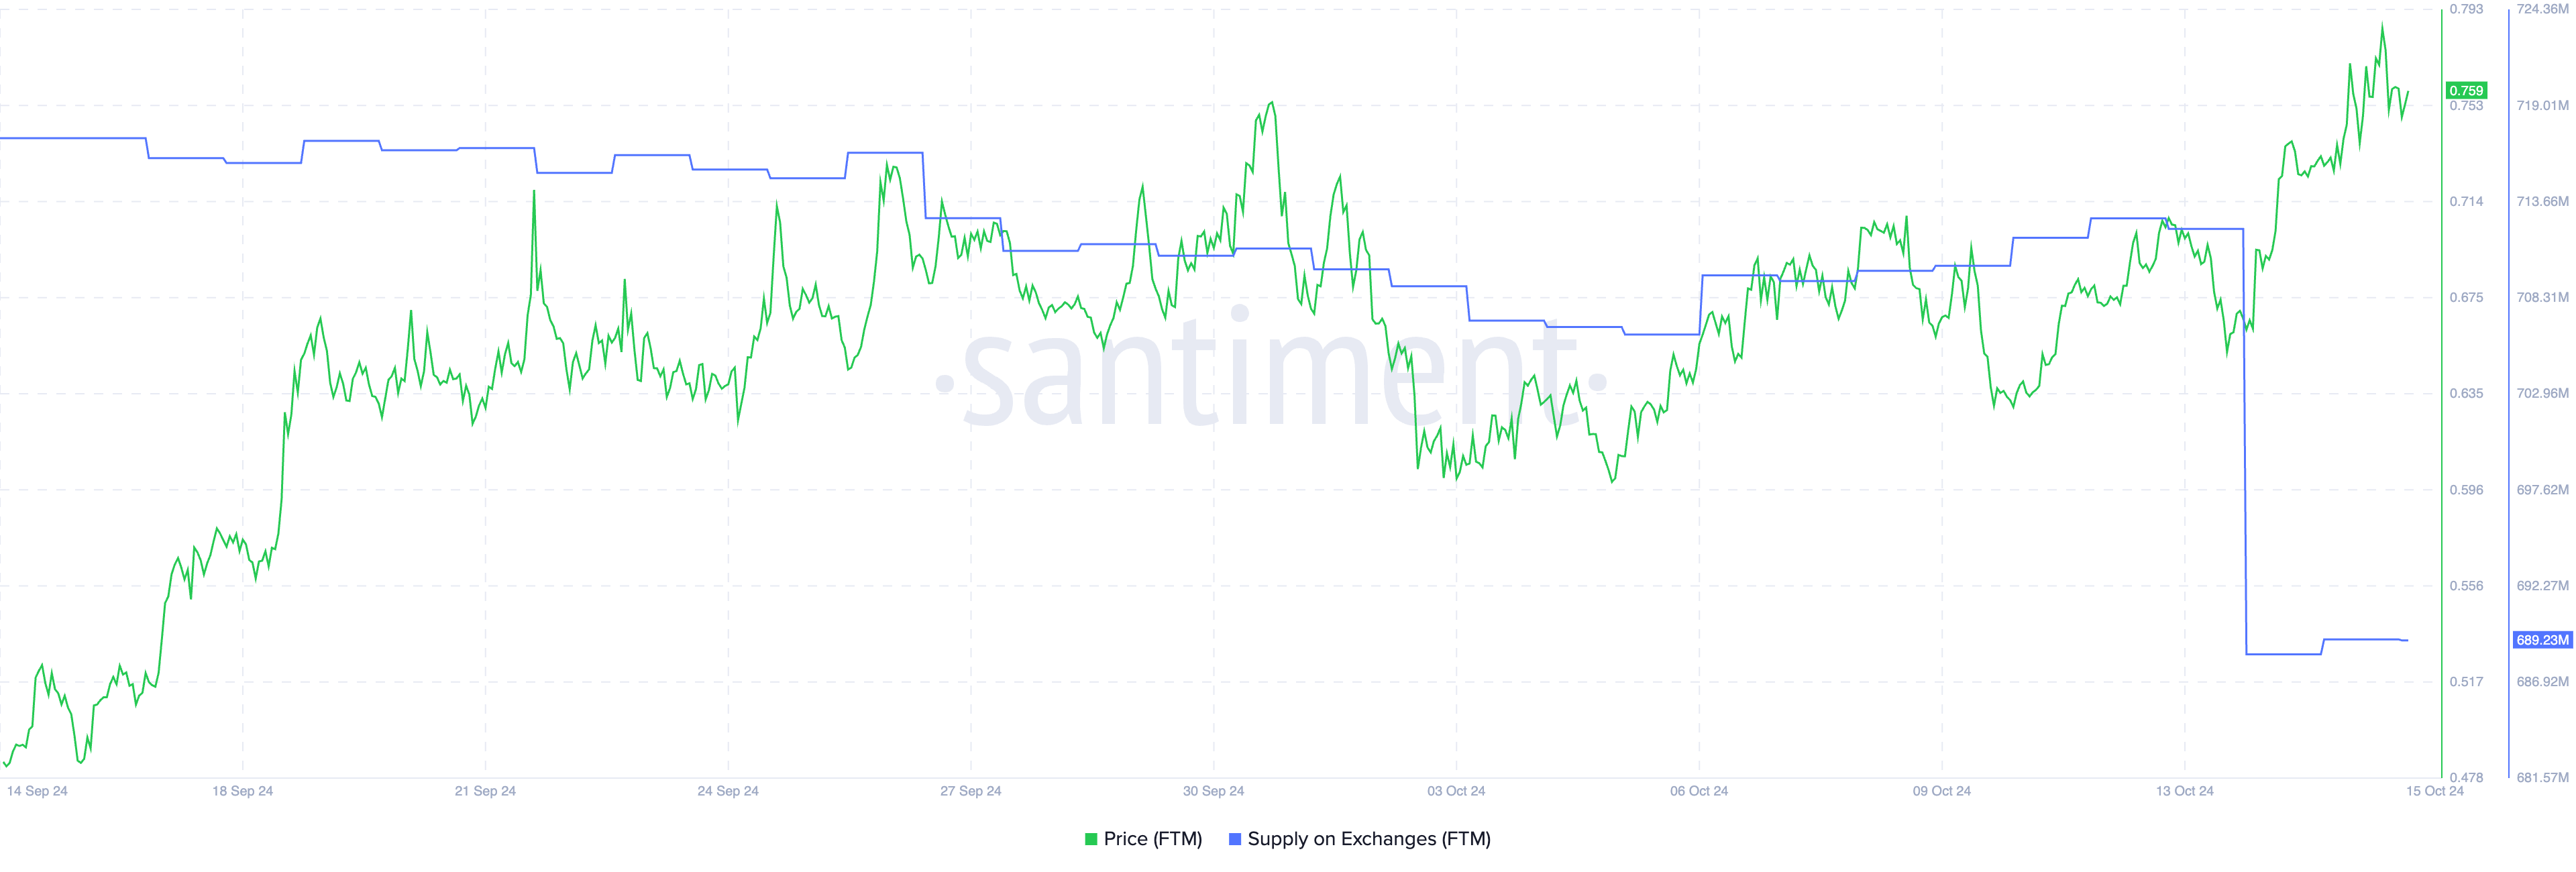
Typically, when users transfer coins to exchanges, it is considered a bearish signal, as they may be preparing to sell. Conversely, when coins are withdrawn from exchanges, it often signals bullish sentiment, indicating that holders are not planning to sell soon and might be expecting a price increase.
After the initial drop in FTM’s exchange supply, the amount has since stabilized, but it remains crucial to keep monitoring this metric. Changes in supply on exchanges can provide valuable insight into potential shifts in market sentiment.
Fantom Price Prediction: Can It Rise Back To $0.96 In October?
FTM’s EMA (Exponential Moving Averages) lines are currently bullish, with a healthy gap between the short-term and long-term lines. This indicates strong upward momentum, as the price has maintained a clear lead in the recent trend.
When short-term EMAs are positioned well above the long-term ones, it signifies that recent price action is more favorable compared to the longer average, reflecting bullish sentiment in the market.
EMA lines are used to smooth out price data by giving more weight to recent prices. This helps traders identify the direction of a trend and spot changes in momentum earlier.
Read more: 9 Best Fantom (FTM) Wallets in 2024
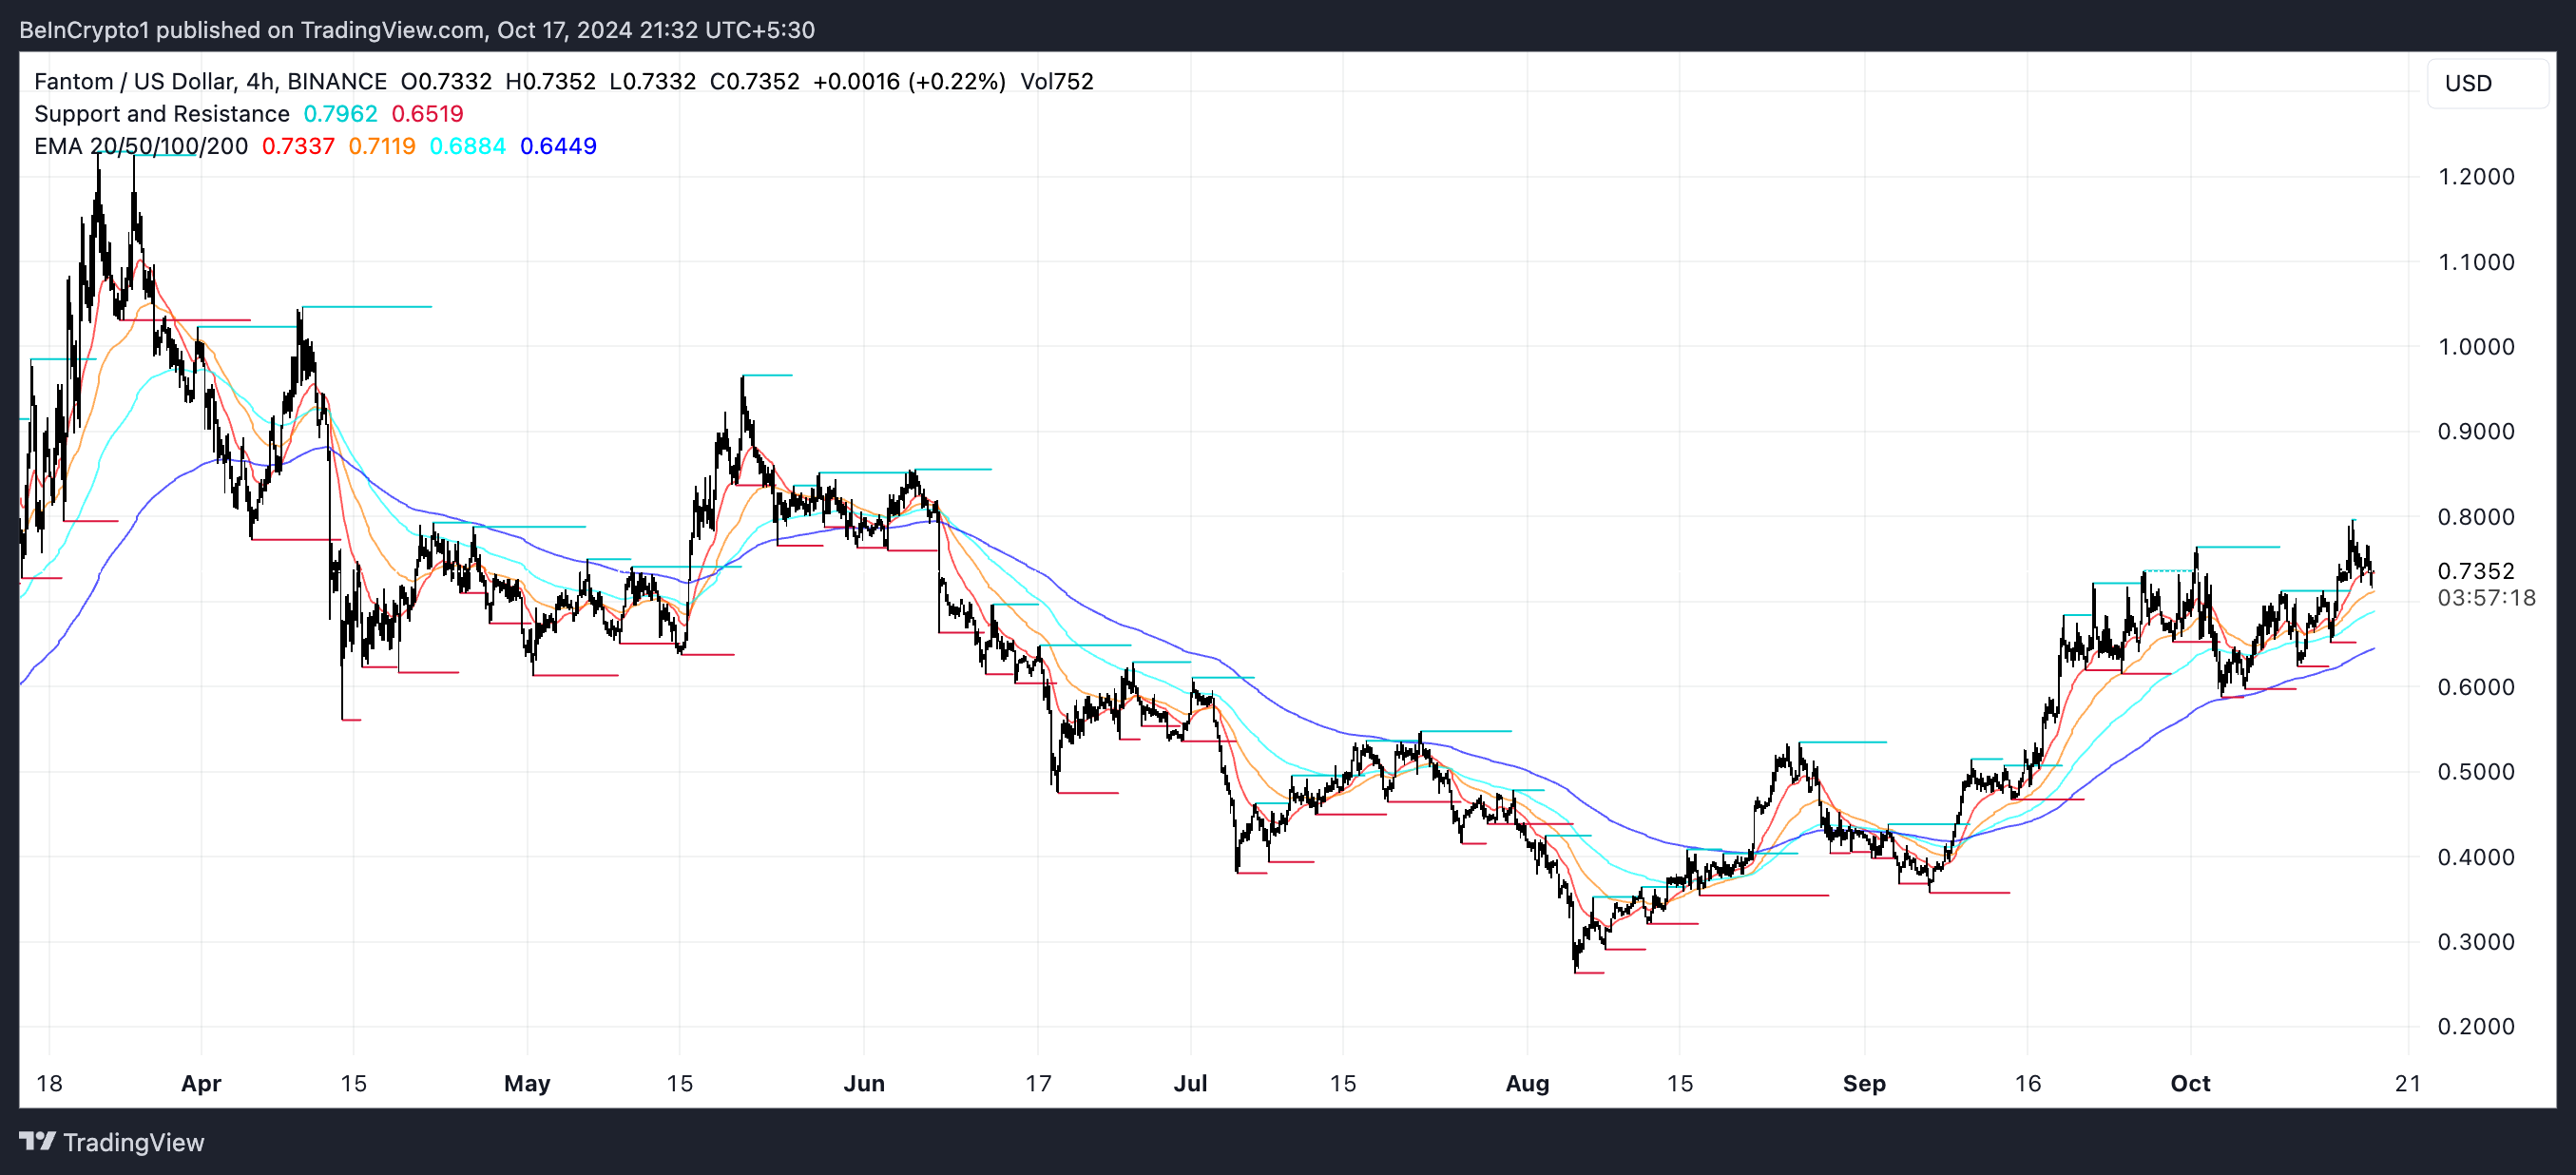
However, after the recent price surge, FTM’s short-term EMAs have started to curve downwards. If they cross below the long-term EMAs, it will form a “death cross,” a bearish signal that suggests a potential reversal in trend and further downside.
If such a scenario happens, FTM’s price could test support levels at $0.65 and $0.59. On the other hand, if the uptrend regains strength, FTM could continue its rise, challenging resistance at $0.76 — a level it recently failed to surpass. Breaking past that could push FTM back towards $0.85 or even $0.96, its highest price since May.
Disclaimer
In line with the Trust Project guidelines, this price analysis article is for informational purposes only and should not be considered financial or investment advice. BeInCrypto is committed to accurate, unbiased reporting, but market conditions are subject to change without notice. Always conduct your own research and consult with a professional before making any financial decisions. Please note that our Terms and Conditions, Privacy Policy, and Disclaimers have been updated.