


 leads $489M token unlocks, Solana tops linear unlocks")
 Price Predictions Following the Surge Above $1")


A potential flag pattern in BTC suggests an impending directional move, with $60,000 acting as robust support for buyers. The intraday trading volume for Bitcoin sits at $25 billion, signaling a 12% loss.
In February, Bitcoin (BTC), the top cryptocurrency, saw strong growth, soaring from $42,279 to $46,000, marking a remarkable 51.4% increase. But as March began, its volatility surged. Attempts to recover were hindered by resistance at $64,000. Over the weekend, Bitcoin showed a consolidation pattern, suggesting a potential bullish continuation, known as a Pennant formation.
Bitcoin Recovery Faces Resistance at $64,000
The current uptrend in Bitcoin is encountering significant supply pressure at the $64,000 mark, as evidenced by the presence of long-wick rejection candles. This overhead selling pressure has caused Bitcoin’s price to move sideways, mirroring the behavior of major altcoins. This indicates a market sentiment of consolidation following a rally.
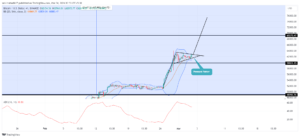
Bitcoin Price| Tradingview
A closer analysis of the 4-hour time frame charts reveals that this sideways movement is confined within two converging trendlines, suggesting the formation of symmetrical patterns. This chart pattern provides a temporary breather for Bitcoin, allowing it to gather strength for its next upward move.
Analyzing Bitcoin’s March Performance Over the Years
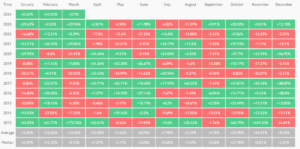
Recent data from Coinglass provides insights into Bitcoin’s monthly returns from 2013 to 2024. Specifically focusing on March, the trend appears mixed, with positive returns observed in five out of the eleven years listed.
March returns for Bitcoin have shown notable fluctuations, ranging from a high of +172% in 2013 to a low of -32.85% in 2018. Despite these extremes, the average March return over these years stands at +12.20%, with a median return of -1.11%. This suggests that, on average, Bitcoin has seen slight positive performance during the month of March.
Bitcoin’s March Performance: Historical Insights and Future Prospects
The presence of both significant positive and negative returns in March indicates a lack of consistent trends during this period. This makes it challenging to predict future performance based solely on historical data.
Technical Analysis and Price Movement
Currently trading at $62,802, Bitcoin’s price suggests a potential bullish breakout from the upper boundary of the pennant chart pattern. A successful breakout, confirmed by a 4-hour candle closing above this boundary, would signal the continuation of the prevailing trend. If the pattern holds true, Bitcoin’s price could target $66,655, followed by $75,000.
Bollinger Band: The squeezed range of the Bollinger Band indicator highlights increased volatility in Bitcoin.
Average Directional Index (ADX): The downsloping ADX slope at 49% indicates that Bitcoin buyers are regaining strength amidst the current consolidation phase.
Important: Please note that this article is only meant to provide information and should not be taken as legal, tax, investment, financial, or any other type of advice.
Join Cryptos Headlines Community
Follow Cryptos Headlines on Google News