The collaboration between Hitachi US and the Hedera Council marks a substantial merger of industrial know-how with cutting-edge blockchain technology.
Focused on spearheading proof-of-concepts in supply chain and sustainability, the partnership capitalizes on Hitachi’s extensive industry knowledge. However, market trends surrounding Hedera’s HBAR token indicate volatility, with ongoing selling pressure and a possible impending price decline, as indicated by technical indicators.
Hitachi US Joins Hedera Council for Blockchain Innovation
Hitachi US and Hedera Council have joined forces, aiming to blend Hitachi’s industry expertise with Hedera’s blockchain tech. The collaboration plans to initiate projects developing proof-of-concepts for holistic supply chain and sustainability solutions in the coming year.
Hitachi US, known for diverse products in electronics, healthcare, energy, and IoT, brings innovation to the industrial sector. Their integration into the Hedera Council indicates a move to leverage their experience for transformative industrial applications. The partnership is expected to showcase the practical use of web3 technologies in real-world scenarios.
2/ @Hitachi_US offers a broad range of products and solutions in electronics, healthcare, energy, IoT, and more throughout the Americas. As a leader in the development of innovation-led industrial use cases, Hitachi is a unique and valuable addition to the #Hedera Council. pic.twitter.com/qx68GYJbDV
— Hedera (@hedera) January 15, 2024
HBAR Market Impact and Technical Analysis Post Hitachi-US-Hedera-Council
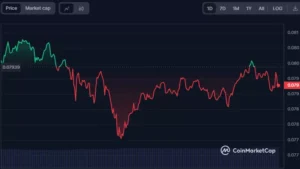
The announcement of Hitachi US joining the Hedera Council has reverberated in the crypto market, influencing the price of Hedera’s native token, HBAR. Currently priced at around $0.07847, HBAR experienced declines of 1.75% in the last day and 0.56% over the past week. Despite these fluctuations, Hedera maintains a substantial market cap of $2,638,745,973, underscoring its prominence in the cryptocurrency space.

HBAR/USDT 1-Day chart (Source: Coinmarketcap)
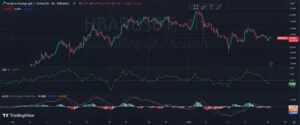
However, a closer look at the technical analysis of HBAR’s price movement reveals a mixed sentiment in the market. The Chaikin Money Flow indicator on the 4-hour chart signals selling pressure, with a downward movement at -0.11, indicating a higher likelihood of investors disposing of their assets and a continued decline in prices.

HBAR/USDT 4-Hour chart (Source: Tradingview)
Adding to the complexity of market sentiment, the MACD line is currently below its signal in the 4-hour chart, presenting a bearish indicator. This aligns with the concept of selling pressure and strengthens the probability of a downward price movement. Traders are advised to exercise caution and consider this crossover as a potential confirmation of a trend reversal while making their trading decisions.
Important: Please note that this article is only meant to provide information and should not be taken as legal, tax, investment, financial, or any other type of advice.
Join Cryptos Headlines Community
Follow Cryptos Headlines on Google News


