


 Tops as Ethereum Meme Coin")
 Jumps 5% After Delisting: Is $190 Next?")
When the price of Polygon (MATIC) stays above $0.945, it gives buyers a good opportunity to push it even higher. It’s like a strong platform they can use to launch a bigger rally.

Despite the uncertain market conditions, Polygon coin has been holding steady above the $0.945 mark. Right now, it’s trading at $0.992, and there’s less resistance at this level, indicating that buyers are gathering more of the coin. Since the price has risen by more than 50% from its recent low, it suggests that buyers are in control, making it more likely for the coin to continue its upward trend.
Analyzing Polygon Coin’s Recent Growth and Future Outlook
For the past month, Polygon coin has been on a steady upward trajectory, bouncing back from $0.718 to $0.9995, marking a significant 40% increase. This swift rise, characterized by increased trading volume, signals an aggressive rally with buyers taking control.
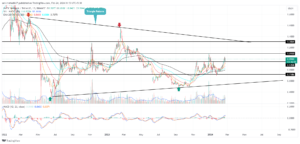
Polygon Coin Price – Source: TradingView
On February 18th, the coin surpassed a crucial resistance level of $0.948, paving the way for further upward movement. However, the sideways movement of Bitcoin, the leading cryptocurrency, has led to a decrease in bullish momentum across the altcoin market, including Polygon.
Despite this, a recent daily candle with a long rejection at the support level suggests renewed buying interest among investors. A potential surge from this point could propel the MATIC price by 10%, aiming to challenge the previous swing resistance at $1.1.
A closer look at the daily chart reveals that the current uptrend is part of a long-standing chart pattern known as a symmetrical triangle, which has persisted for the past two years. This pattern is expected to have a significant impact on Polygon’s near-term future.
Should the price break above $1.1, it could trigger another 20% surge towards the downward sloping resistance trendline. However, historical data suggests that intense selling pressure may emerge at this barrier, potentially leading to a continuation of the sideways trend.
Analyzing Technical Indicators for Polygon Coin
Exponential Moving Average (EMA): The slow-moving 200-day EMA indicates that the broader trend for Polygon coin is sideways. This means that over the long term, there hasn’t been a significant directional bias in price movement.
Moving Average Convergence Divergence (MACD): A recent bullish crossover between the MACD and the signal line suggests a short-term bullish trend for Polygon coin. This indicates that in the near future, there is a positive momentum building, potentially leading to upward price movement.
Important: Please note that this article is only meant to provide information and should not be taken as legal, tax, investment, financial, or any other type of advice.
Join Cryptos Headlines Community
Follow Cryptos Headlines on Google News
Author