Artificial Superintelligence Alliance (FET) has shown signs of recovery after a week of losses. The token recorded a 2.07% gain in the past 24 hours, sparking speculation of a potential rebound. Analysts have pointed to historical patterns and technical indicators as possible signals for a more significant price movement in the near term.
Broadening Wedges Signal Potential Upside
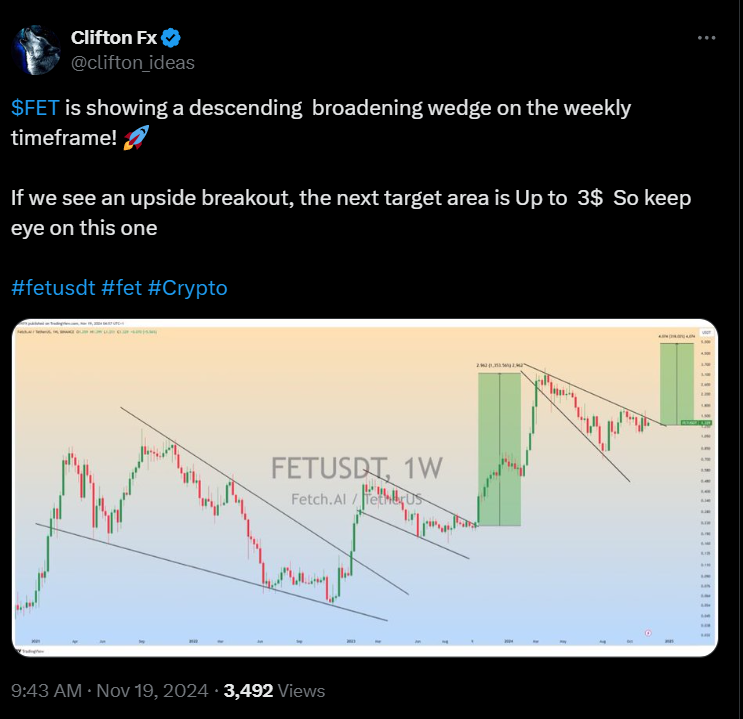
On the FET/USDT weekly chart, Clifton Fx identified two descending broadening wedges. These patterns, which display lower highs and lower lows with increasing price ranges, often precede bullish reversals. In FET’s case, a previous wedge breakout led to a remarkable price surge 15 weeks after the breakout. During that rally, FET added $2.9 to its value, marking a 1,353% increase.


If history repeats, a breakout above the current resistance trendline could spark a strong upward move. The analyst identified a potential target of $3.00. This aligns with a key resistance level seen earlier this year. Recent consolidation within the wedge also points to an accumulation phase. Such phases often occur before high-momentum breakouts.
Further analysis shows significant short liquidation leverage near the $1.515 mark totaling around $12 million. If these shorts are liquidated, FET’s price could rise sharply. This scenario supports Clifton Fx’s projection of a move toward $3.00. It also highlights FET’s potential to challenge its all-time high of $3.47. However, this depends on broader market sentiment and sustained buying pressure.
Toncoin Declines, FET Surges: Analyst Unveil Insights
Weekly Indicators Bullish
Weekly indicators provide additional insights into FET’s potential trajectory. The Relative Strength Index (RSI), currently at 48.73, sits below the neutral level of 50 but shows a slight upward trend. This positioning suggests consolidation, with the possibility of a shift in momentum. If the RSI moves above 50, bullish momentum could accelerate, while a dip below 40 might signal further bearish action.
The possible bullish shift is also given by the Moving Average Convergence Divergence (MACD) indicator. The signal line crossed above the MACD line recently, a good positive but weak signal with small histogram bars. The existence of this crossover indicates the possibility of upward momentum, but only as long as it’s not merely temporal.
In conclusion, FET’s recent price action and technical setup suggest that the token is standing at a crossroads. Moreover, there are supporting indicators and critical liquidation levels combined with descending broadening wedges implying the possibility for bullish breakout. The view is confirmed by historical patterns where there is a history of substantial gains after breakouts. But beyond that still is whether FET can gain from those signs and recover to its previous all time high.


