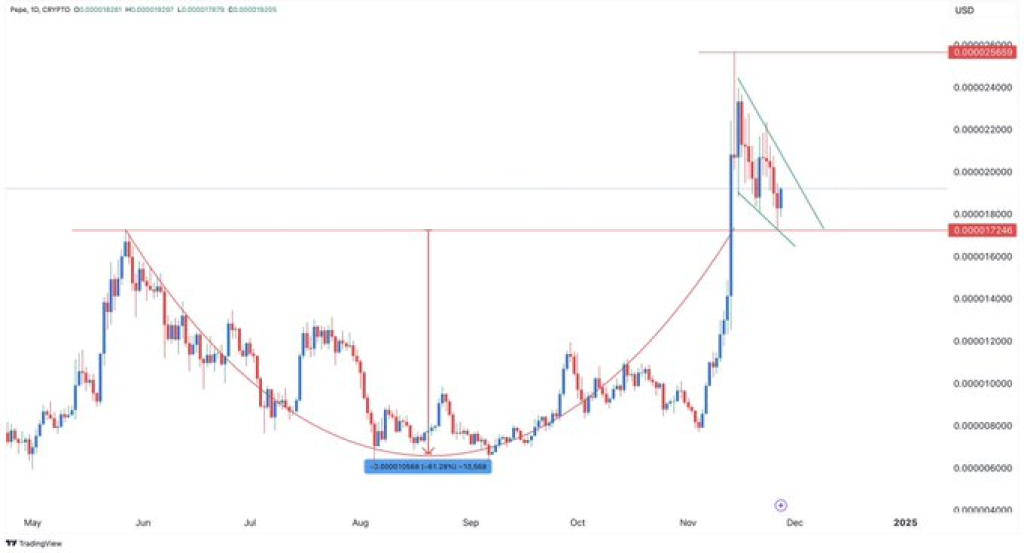

PEPE is turning heads in the crypto space as it completed a chart pattern analysts suggest could indicate a bullish breakout. Prominent analyst Keller Call shared on X (formerly Twitter) that PEPE’s price has finalized a “break and retest” phase, which often precedes upward price movement. This analysis, supported by a detailed examination of PEPE’s price chart, reveals multiple factors hinting at a potential rally.
PEPE Chart Analysis: Break and Retest Pattern Signals Bullish Momentum
PEPE broke past $0.000001800 and then dipped back to test that level – this pattern traders often see as bullish. The price bounced off $0.000001800, showing it’s now acting as strong support. This successful retest aligns with bullish market behavior, suggesting that buyers are stepping in at this critical zone.
The next big level to watch is $0.000002400. Breaking above that could mean PEPE’s price upward trend will continue.
The chart also reveals a well-defined “cup and handle” pattern, a well-known bullish technical indicator. The rounded base of the cup, formed between May and November, suggests accumulation and gradual recovery after a downtrend.


Following the breakout in November, the handle—characterized by a descending channel—indicates a consolidation phase. This pattern often leads to a breakout above the handle, confirming bullish sentiment.
Based on the current price movement, PEPE could make another surge higher if this setup is completed. Looking at the pattern, multiplying the cup’s range from $0.000001200 to $0.000002400 suggests a potential target of $0.000003600 on a breakout.
Read Also: Polygon Whales Go On a Massive Buying Spree – Will POL Price Pump?
Insights From the Analyst’s Tweet
Keller Call’s tweet underscores the potential for a bullish move, supported by the observed break and retest formation. The mention of PEPE being “about to go crazy” reflects confidence in the setup, with the implication that the chart is nearing a breakout point. While no specific time frame is provided, the alignment of technical factors makes this a scenario worth monitoring.
As PEPE trades within the handle’s descending channel, a breakout above this pattern could confirm the bullish thesis. Traders are advised to monitor the $0.000002400 resistance level and the descending channel for signs of upward momentum. Conversely, failure to hold the $0.000001800 support level could invalidate this setup and lead to further consolidation.
PEPE’s price movements remain a focal point for traders and analysts alike, with the chart pattern and support levels indicating a potentially pivotal moment for the token.
Follow us on X (Twitter), CoinMarketCap and Binance Square for more daily crypto updates.
Get all our future calls by joining our FREE Telegram group.
We recommend eToro
Active user community and social features like news feeds, chats for specific coins available for trading.
Wide range of assets: cryptocurrencies alongside other investment products such as stocks and ETFs.
Copy trading: allows users to copy the trades of leading traders, for free.
User-friendly: eToro’s web-based platform and mobile app are user-friendly and easy to navigate.
Source link


