


 and Sandbox (SAND) Prices Pumping? Tokens Could Dip Over 60% Again")


Chainlink’s LINK price has surged by more than 40%, now trading above $10. Bullish momentum appears to be at play, and there’s potential for a push toward the $12 resistance level.
Currently, Chainlink’s price is gaining ground above the $10.00 mark and the 100-day simple moving average against the US dollar. On the daily chart for the LINK/USD pair (data source: Kraken), there’s an important bullish trend line taking shape, with support around $8.60. This indicates that the price may continue to rise, targeting the $11.25 and $12.00 resistance levels.
Chainlink’s Recent Strong Price Surge
Chainlink’s LINK price has experienced a significant upswing against the US Dollar in the past few days. The price established a base above $7.00 before the bulls entered the scene. This led to a substantial surge above the resistance levels of $7.50 and $8.00.
Over the last three days, the price has soared by more than 40%, overcoming various obstacles around $9.00. The recent rise in Bitcoin’s price also contributed to LINK’s breakthrough of the $10.00 resistance. This surge resulted in a new multi-week high, reaching approximately $10.99.
The price is currently consolidating its gains, comfortably staying above the 23.6% Fibonacci retracement level of the upward movement from the swing low of $7.11 to the high of $10.99.
Furthermore, LINK is now trading above $10.00 and the 100-day simple moving average on the four-hour chart. Additionally, a crucial bullish trend line is forming, with support at about $8.60, as seen on the daily chart for the LINK/USD pair. This trend line aligns closely with the 61.8% Fibonacci retracement level of the upward move from the $7.11 swing low to the $10.99 high.
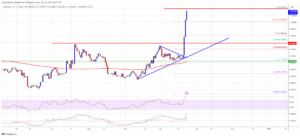
Source: LINKUSD on TradingView.com
In the event of another uptick, the price may encounter resistance near $11.20, with the primary resistance at approximately $12.00. A decisive break above $12.00 could potentially trigger a steady ascent towards the $12.20 and $12.50 levels. Beyond these levels, the next significant resistance emerges around $13.20, which, if breached, might lead to a test of $15.00.
Are LINK Dips Restricted?
If Chainlink is unable to surpass the $11.20 resistance level, there might be a downward correction. The initial support on the downside can be found around the $10.00 level.
The next significant support level is approximately $9.00, and if this level is breached, the price could test the support provided by the trend line at $8.60. Further losses might lead LINK towards the $8.00 level in the near future.
Technical Indicators
- 4-Hour MACD: The MACD indicator for LINK/USD is gaining strength in the bullish zone.
- 4-Hour RSI (Relative Strength Index): The RSI for LINK/USD is currently above the 50 level.
Key Support and Resistance Levels
- Major Support Levels: $10.00 and $9.00.
- Major Resistance Levels: $11.20 and $12.00.
Important: Please note that this article is only meant to provide information and should not be taken as legal, tax, investment, financial, or any other type of advice.
Join Cryptos Headlines Community
Follow Cryptos Headlines on Google News