- XMR, at press time, was facing selling pressure in the market due to Kraken’s delisting announcement
- RSI and MACD readings on XMR/USD’s 4-hour chart pointed to a downtrend continuation
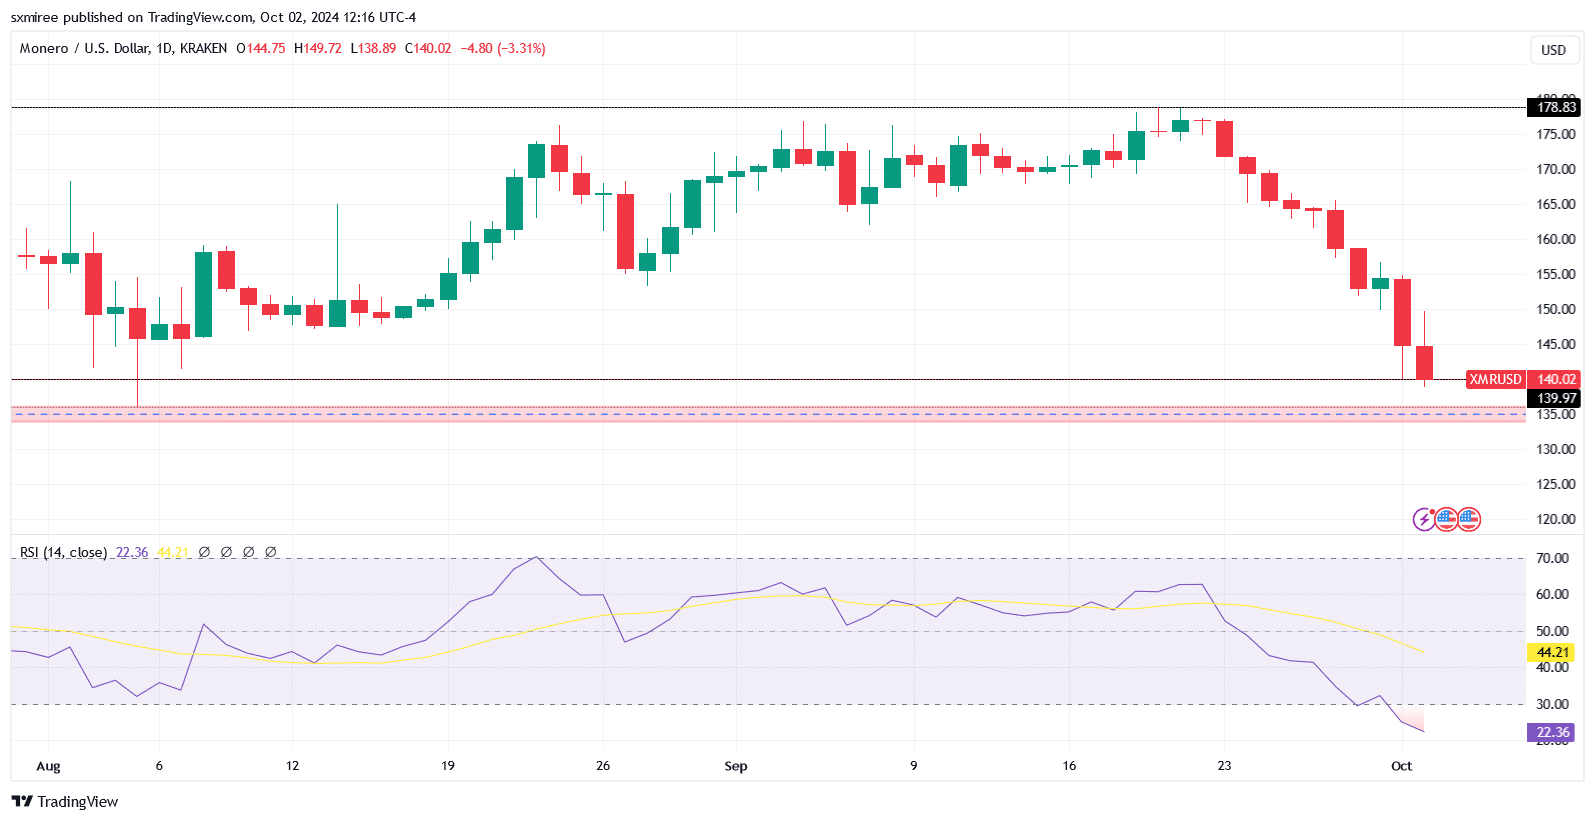
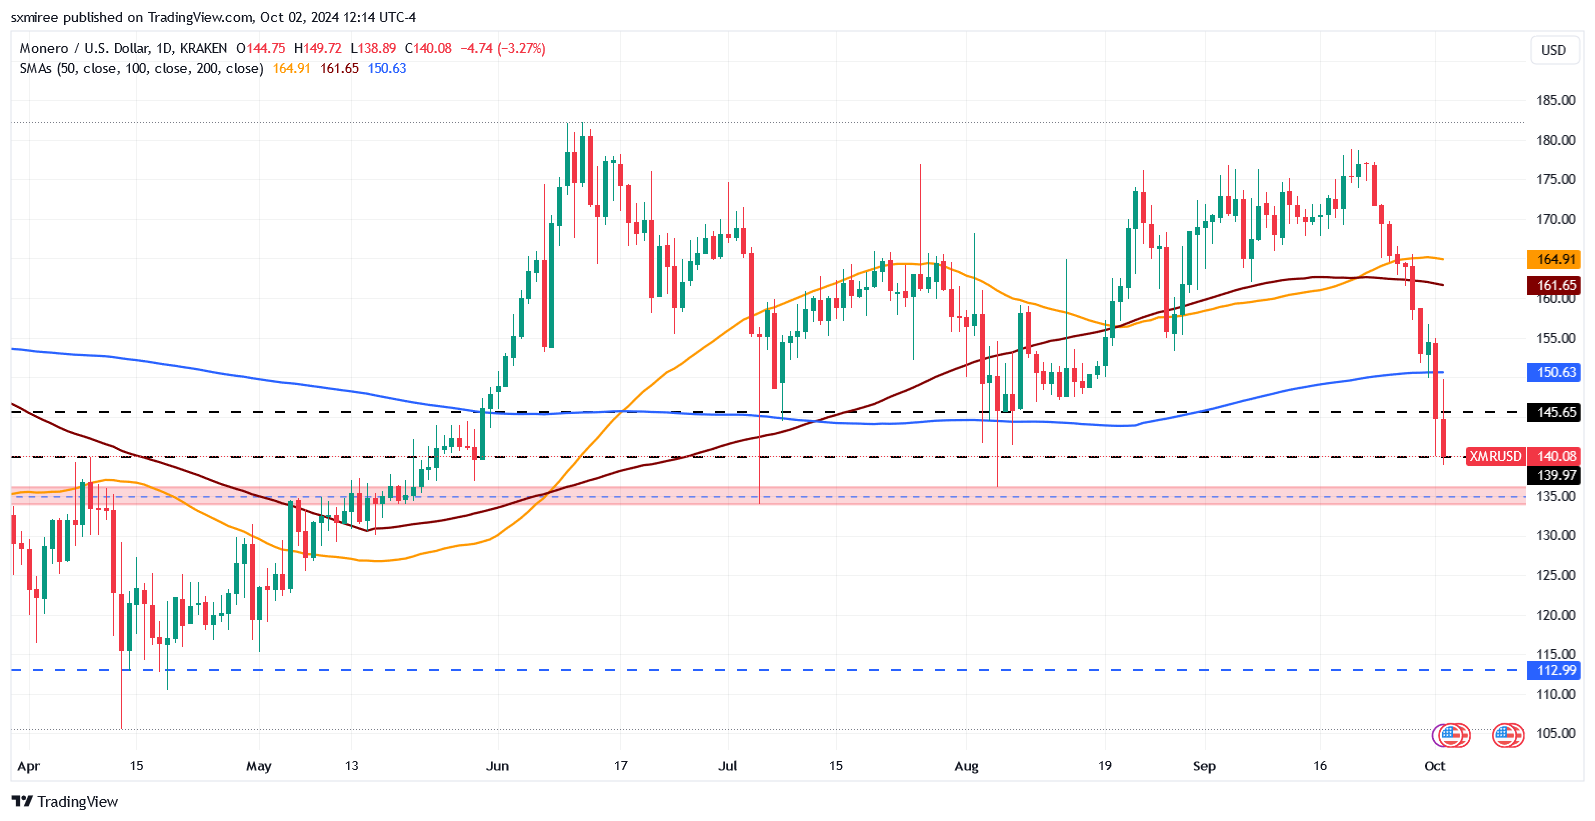
Monero (XMR) has been rocked by more headwinds in the market this week, dropping below its long-standing support of around $146 on 1 October. The privacy-focused coin extended its dip earlier today, posting an intra-day low of $139 on the charts.
In fact, an assessment of XMR’s charts revealed that it may be on course to print a consecutive red daily candle. This, on the back of an 8-day streak of successive lower closes between 23 September and 30 September .
At the time of writing, XMR was changing hands at $140, down 16% in the past 7 days. The renewed downside action this week erased gains made since early August, at a time when Monero (XMR) traded near its $146 support.
Exchange delisting setbacks
Commentators attributed Tuesday’s sharp price decline to the prevailing bearish sentiment. The same was precipitated by tensions in the Middle East and Kraken’s XMR delisting announcement.
In a notice to users registered in the EEA region, Kraken said it plans to halt support for XMR by the end of the month. The exchange’s decision to delist Monero for its European users comes amid growing regulatory pressure on privacy-oriented coins used to facilitate illicit activities.
Kraken’s move to cease trading and deposits of all XMR markets in Europe follows similar actions by other exchanges. This has contributed to the bearish sentiment surrounding the coin.
A bearish outlook
Technical analysis painted a negative and troubling outlook for Monero (XMR) too. According to the same, it may be on course to retest the support range between $134 and $136.
This zone, coinciding with previous lows in the first weeks of July and August, represents a psychological threshold where traders will watch to see if buyers will step in.
A break below this floor will leave XMR in an indecisive zone, potentially opening the door for further declines towards $112. This level previously served as a major support in mid-April.
Meanwhile, the Relative Strength Index and the Moving Average Convergence Divergence on the 4-hour chart reflected an extremely bearish outlook. In fact, the 4-hour RSI’s reading dropped into the oversold zone today, indicating that XMR is still experiencing heavy selling pressure amid strong downtrends.
MACD analysis pointed to the momentum being firmly in the hands of the bears. The MACD line fell below the signal line on 1 October, suggesting that downward momentum has been increasing, potentially continuing the decline.
The MACD and Signal lines were pictured still in negative territory at the time of writing, highlighting the sustained bearish trend.
Market sentiment and short positions
Finally, sustained weakness in the market means that the path of least resistance remains to the downside. This can spur speculators to consider shorting plays.
However, a close above the 200-day SMA at $151 would signal shifting momentum and hint at a reversal.


