- A bullish pennant pattern appeared on the memecoin’s chart.
- Selling pressure was low, but there were chances of a price correction.
PEPE investors were overwhelmed last week as they enjoyed massive profits. This latest price uptick has pushed the memecoin towards a critical resistance level. Will PEPE finally manage a breakout, which could result in a 200% hike soon?
PEPE on the verge of a breakout
PEPE bulls clearly dominated last week as the memecoin’s price surged by more than 21% in the past seven days. In fact, in the last 5% alone, the coin’s value increased by 5%.
At press time, PEPE was trading at $0.00001098. The latest price uptick has pushed more than 243.5k PEPE investors in profit, which accounted for over 77% of the total number of PEPE addresses, as per IntoTheBlock.
In the meantime, World Of Charts, a popular crypto analyst, posted a tweet revealing a bullish pattern on the coin’s chart. As per the tweet, a bullish pennant pattern emerged on the memecoin’s chart.
To be precise, the pattern appeared in March, and since then the memecoin has been consolidating.
At press time, the memecoin’s price was hovering within a tight range and was testing the resistance of the pattern. In case of a bullish breakout, investors might get surprised with a 200% price rise in the coming months.
Odds of an actual breakout
Since PEPE was testing the resistance of the bullish pennant pattern, AMBCrypto assessed the memecoin’s on-cjhain data to find out whether they also hint at a bullish breakout.
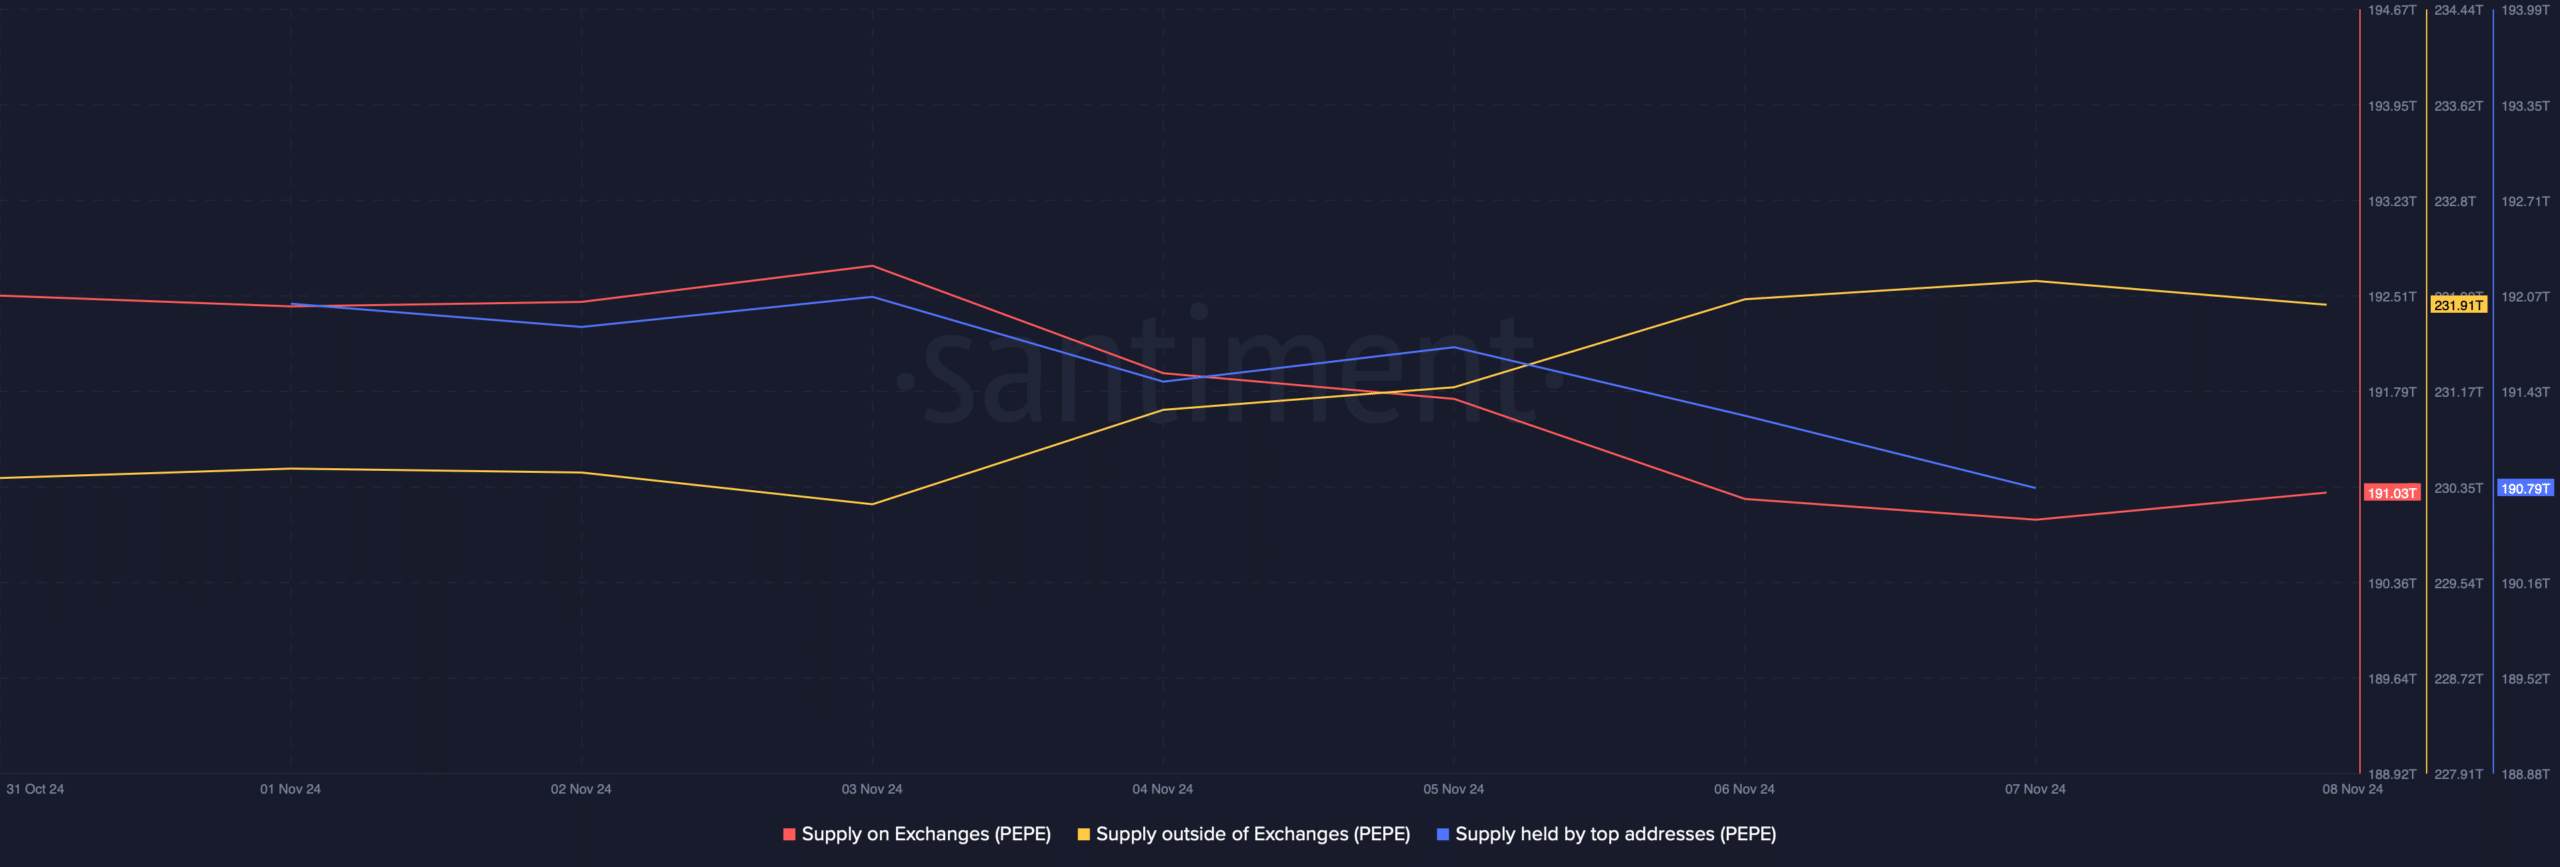
As per our analysis of Santiment’s data, buying pressure on the coin was rising. This was evident from the rise in its supply outside of exchanges and the decline in its supply on exchanges.
Additionally, AMBCrypto reported earlier that PEPE whales added 5.5 million USDT to Binance to acquire 535.81 billion PEPE worth $5.07 million. This reflected their confidence in the memecoin.
However, at press time, memecoin’s supply held by top addresses dropped slightly, indicating a possible whale sell-off amidst the price hike.
Nonetheless, the overall sell pressure continued to remain low. As per AMBCrypto’s look at Hyblock Capital’s data, the memecoin’s sell volume dropped from 100 to 17, meaning that investors were not keen to sell their holdings, which can be considered a bullish signal.
We then checked PEPE’s daily chart to see what technical indicators suggested. We found that after a sharp increase, PEPE’s price had touched the upper limit of the Bollinger Bands.
Realistic or not, here’s PEPE market cap in BTC’s terms
Generally, when prices touch the upper limit of the Bollinger Bands, price corrections follow. If that happens, then the memecoin might first drop to its support at its 20-day Simple Moving Average (SMA).


