- Polkadot showed a bearish structure but the CMF signaled buying pressure.
- The $4 and $4.6 support and resistance zone from the VRVP tool would likely be respected in the coming weeks.
Polkadot [DOT] was able to bounce from the $4 support zone earlier this month, but its momentum has faltered over the past few days. At press time, it appeared headed toward the same support once again.
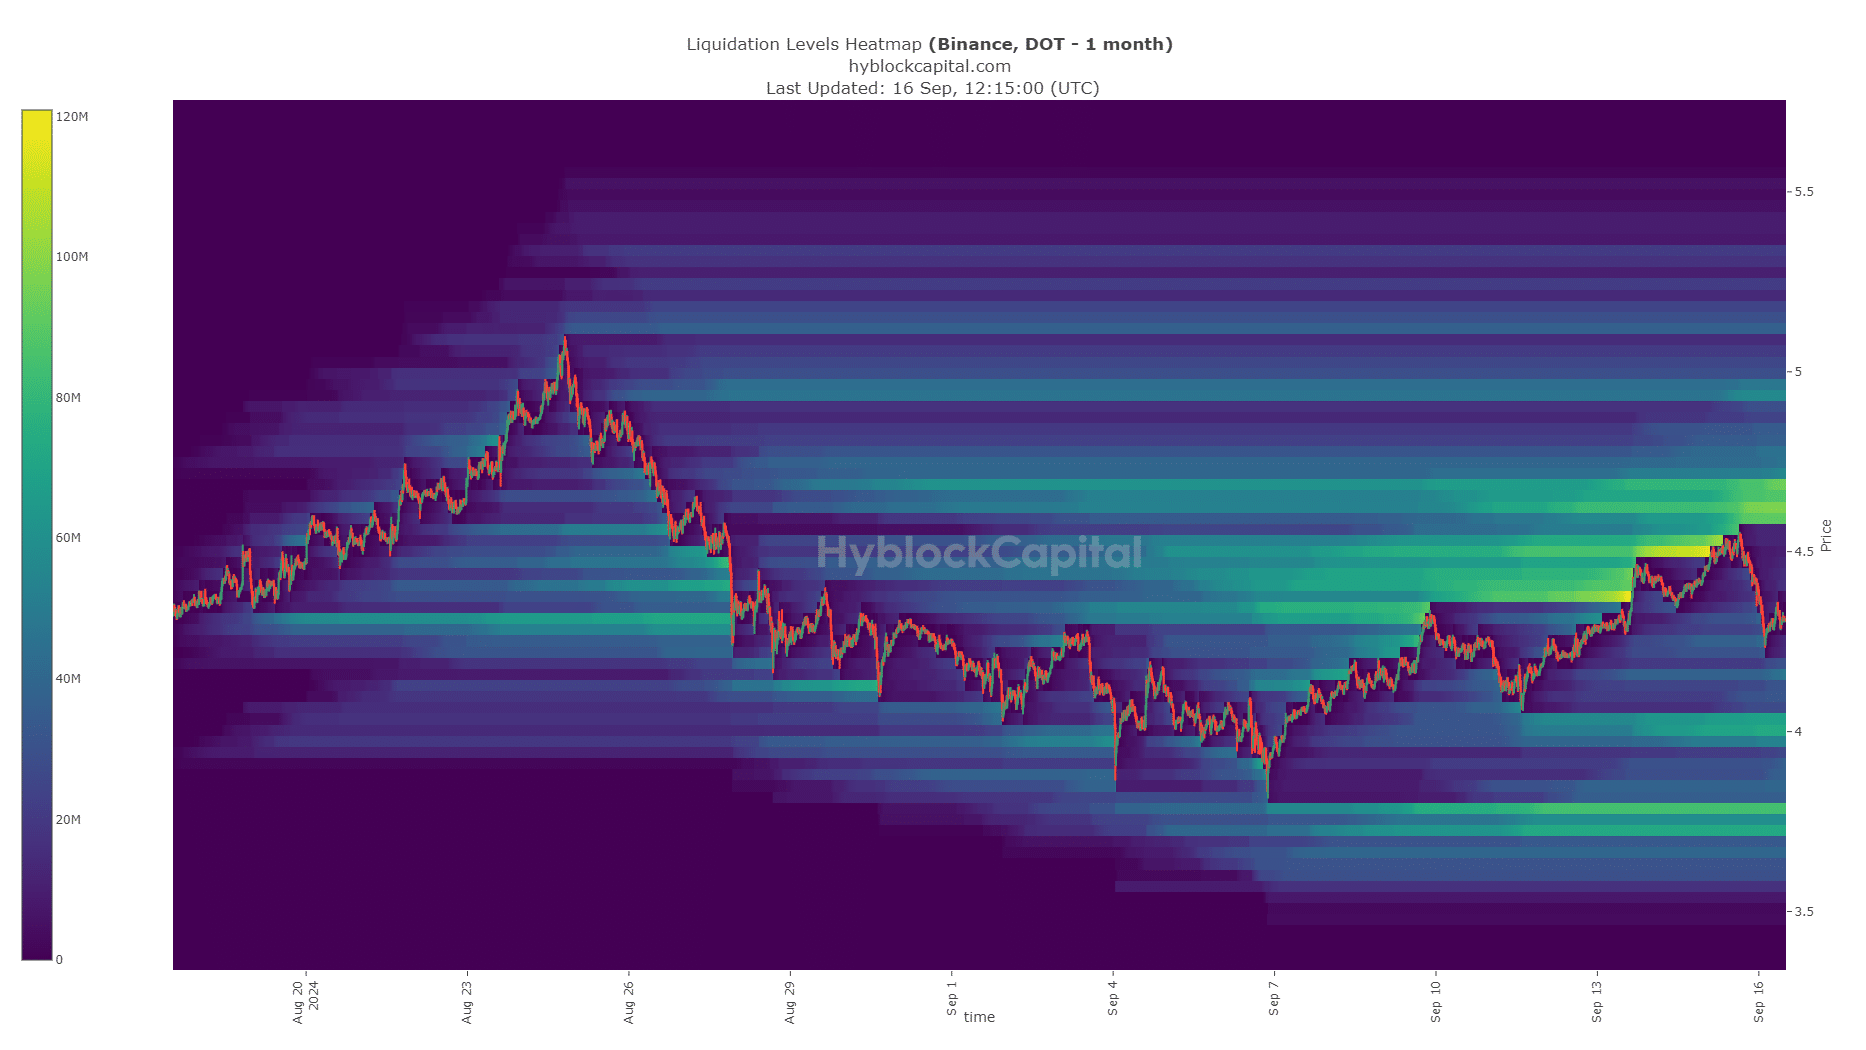
The liquidity chart outlined the possibility of a quick DOT move higher to grab liquidity before a reversal- should traders go long now, or wait for a bounce to short it?
Volume profile shows DOT is under resistance zone
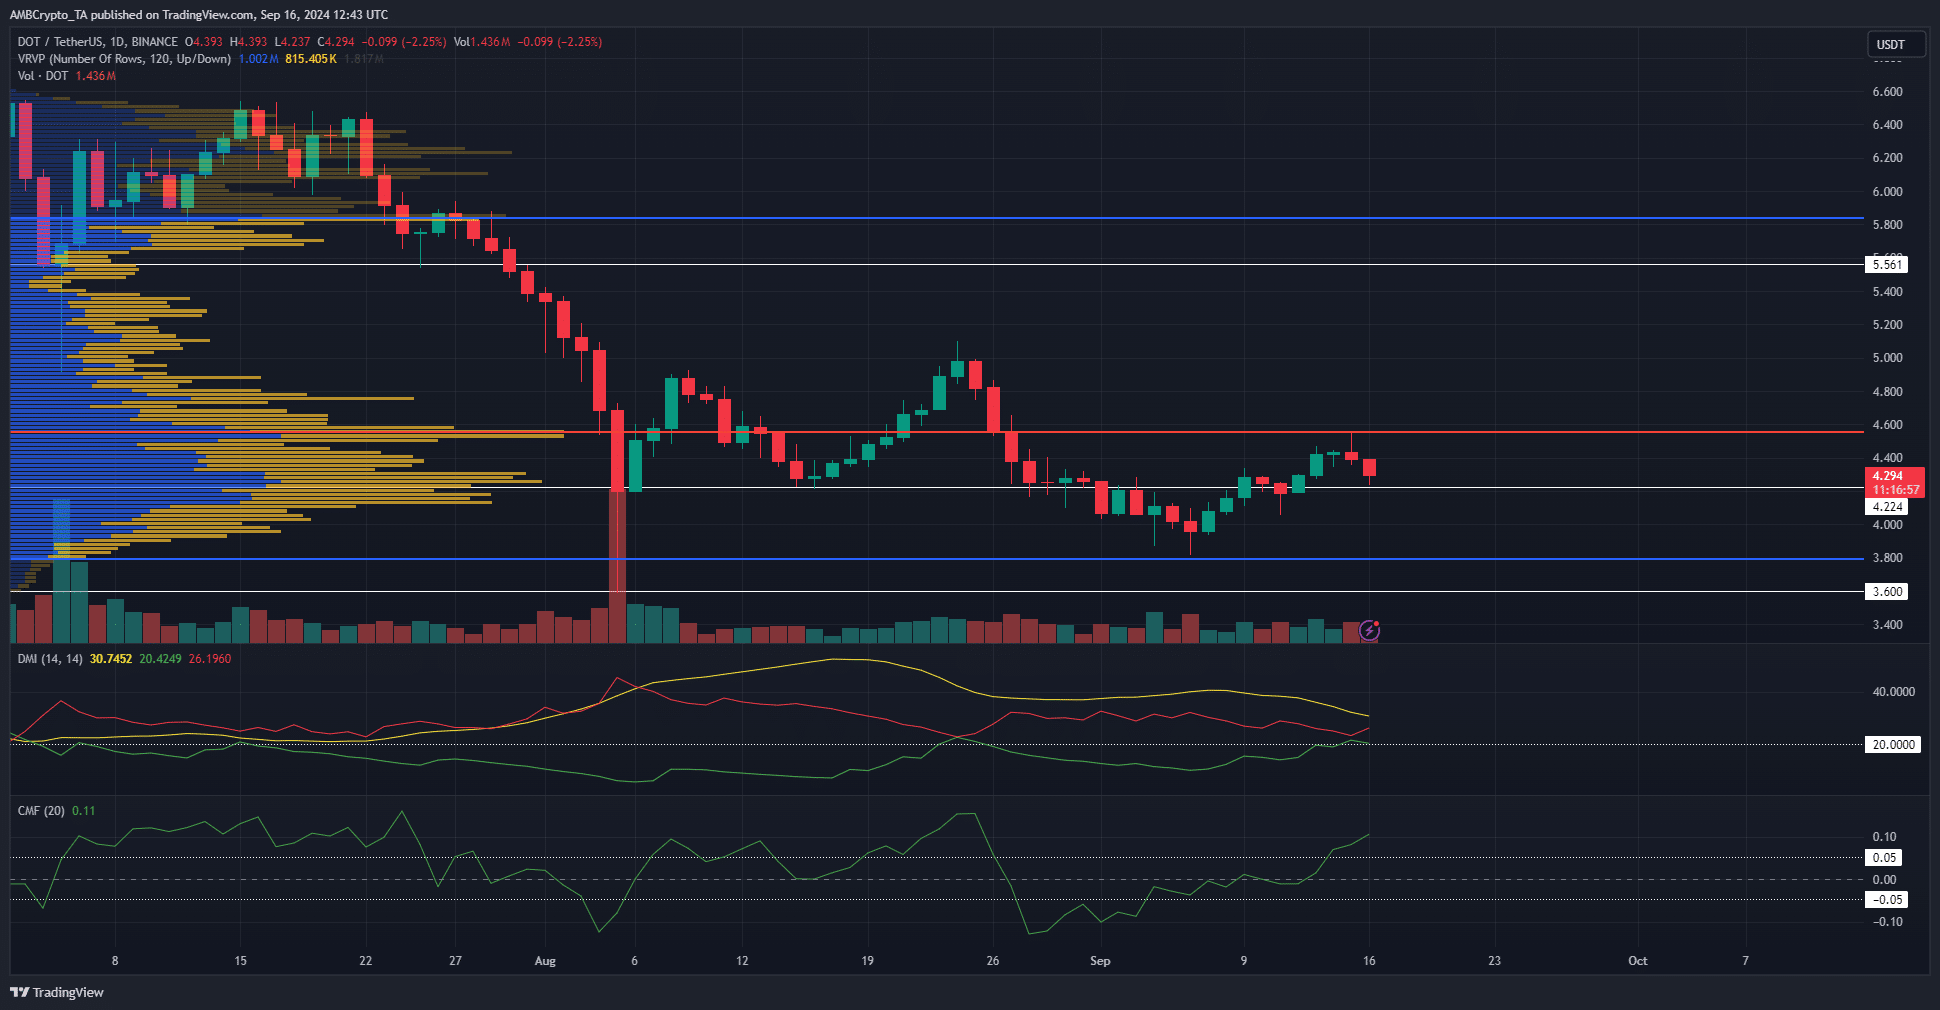
The visible DOT volume profile range extending to early July showed that the point of control was $4.556. The price faced rejection from this level a day earlier and was sinking toward the next high-volume support node at $4.224.
The Directional Movement Index had both the -DI (red) and ADX (yellow) above 20, indicating a strong downtrend in progress. The price action also showed a downtrend in progress since June as DOT formed a series of lower highs and lower lows.
The CMF, contrary to the trend and momentum indicators, was at +0.11 to show significant capital inflow to the market. This uptick in buying pressure was an encouraging sign.
Magnetic zones could lead to range formation


Source: Hyblock
AMBCrypto analyzed the 1-month liquidation heatmap of Polkadot and found two liquidity clusters of interest. The closest and largest band of liquidity was at $4.6-$4.7, and the other one was at the $4 support zone.
Read Polkadot’s [DOT] Price Prediction 2024-25
The pocket to the north is stronger and more likely to attract prices toward it before a reversal toward the $4 liquidity pool. This could see Polkadot establish a range between $4 and $4.7 in the coming weeks.
Disclaimer: The information presented does not constitute financial, investment, trading, or other types of advice and is solely the writer’s opinion


