SHIB’s price broke a long-term descending trend line and horizontal resistance. Weekly outlook is neutral, while daily leans bearish, hinting at a potential decline. Reclaiming the $0.0000095 support could trigger a notable bounce.
On December 17, the Shiba Inu (SHIB) price experienced a breakdown from a short-term continuation pattern. This raises questions about the future direction of SHIB – will it continue to decline, or can we expect a swift recovery?
SHIB Price Dynamics and Token Burns
The weekly analysis of Shiba Inu (SHIB) reveals an upward trend since its low point at $0.0000054 in June. In November, the momentum led to a breakthrough from a descending resistance trend line persisting for 480 days, accompanied by surpassing a horizontal resistance area.
Despite these positive developments, SHIB faced a sharp decline recently, validating the previously mentioned descending resistance trend line. However, the market saw over 12 million SHIB tokens burned in the last 24 hours, marking a substantial increase of over 300% compared to the prior day.
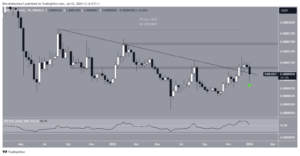
SHIB/USDT Weekly Chart. Source: TradingView
Utilizing the Relative Strength Index (RSI)
Traders often turn to the Relative Strength Index (RSI) to assess momentum and identify potential overbought or oversold conditions. A reading above 50, particularly in an upward trend, is considered favorable for bulls, while a reading below 50 signals the opposite. Notably, the RSI moved above 50 concurrently with the SHIB price breakout, reinforcing the legitimacy of the upward movement.
SHIB Price Analysis: Bearish Signs on Daily Timeframe
Neutral Weekly, Bearish Daily Indicators: While the weekly time frame remains neutral, the daily analysis signals a bearish trend for Shiba Inu (SHIB), evident in both price action and Relative Strength Index (RSI) readings.
Descending Channel and Symmetrical Triangle Breakdown: The price action reveals SHIB trading within an ascending parallel channel since June 2023, typically containing corrective movements. However, a significant bearish signal emerged as SHIB broke down from a symmetrical triangle pattern, suggesting a potential end to the upward trend. The immediate risk is a drop below the minor support level at $0.0000095.
RSI and Potential 20% Decrease: The RSI further supports the bearish sentiment as it recently dropped below 50 and continues to decline. This trend implies a potential 20% decrease in SHIB, with the possibility of reaching the channel’s support trend line at $0.0000075 if the bearish momentum persists.
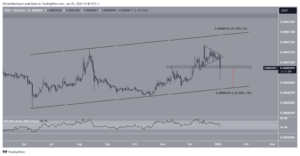
SHIB/USDT Daily Chart. Source: TradingView
Recovery Scenario: Despite the bearish outlook, reclaiming the $0.0000095 support area could trigger a significant recovery, potentially resulting in a 35% increase to the channel’s resistance trend line at $0.000013.
Important: Please note that this article is only meant to provide information and should not be taken as legal, tax, investment, financial, or any other type of advice.
Join Cryptos Headlines Community
Follow Cryptos Headlines on Google News


