


 raises $3 Billion to Purchase More Bitcoin")
Supported by a double-bottom pattern, SOL’s price shows potential to exceed $150, while trading above the 50% Fibonacci retracement level indicates a bullish trend. However, the 24-hour trading volume stands at $2.01 billion, marking a notable 69% decline.
The Solana cryptocurrency is facing a potential price correction due to the formation of a double top pattern, indicating it might drop below the $150 mark. Starting April on a bearish trend alongside the wider market, Solana saw a downturn from $205, resulting in a 12.6% decrease to its current trading price of $179. Analysis of the daily chart suggests a double top pattern, indicating the possibility of an extended decline. However, there’s speculation about whether the upcoming Bitcoin halving could change this outlook and lead to a resurgence in Solana’s price.
Solana Faces Resistance and Potential Price Correction
Amidst the pre-halving consolidation in the crypto market, Solana encountered significant supply pressure at the $205 mark. The coin faced rejection twice from this resistance within three weeks, indicating active defense by sellers.
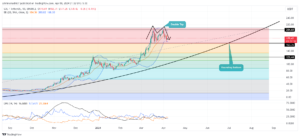
Solana Price| SOL
The repeated rejection at $205 led to the development of a bearish continuation pattern known as a double top. This pattern suggests increasing selling pressure and the potential for an extended correction.
Currently trading at $178, Solana’s price appears to be gradually approaching the pattern’s support level at $163. A bearish breakdown below this support could shift momentum in favor of sellers, potentially leading to a 25% drop to reach $120.
Market Sentiment and Technical Analysis for Solana
Esteemed trader Alicharts recently observed that sentiment surrounding Solana’s native token has reached a significant low point, reminiscent of sentiment levels following the network’s outage on February 6th.
This decline in sentiment is visually represented through a sentiment analysis chart, showing a notable decrease in social volume and sentiment score coinciding with a drop in the SOL price. Alicharts suggests that such pessimism in the market could potentially offer a contrarian opportunity for investors.
Crowd sentiment for $SOL hasn't been this low since the #Solana network outage on February 6. Being contrarian now might just pay off! pic.twitter.com/huLZIsafTt
— Ali (@ali_charts) April 6, 2024
For the SOL price to maintain a bullish trend, it must sustain above the 50% retracement level at $111, as indicated by the Fibonacci retracement tool.
Technical Indicators Analysis
The Directional Movement Index (DMI) shows a bearish crossover between the DI+ (blue) and DI- (pink), indicating a potential shift to a bearish trend in the near term. Additionally, the squeezed range of Bollinger band indicators reflects increasing volatility in SOL, as indicated by the BB indicator.
Important: Please note that this article is only meant to provide information and should not be taken as legal, tax, investment, financial, or any other type of advice.
Join Cryptos Headlines Community
Follow Cryptos Headlines on Google News