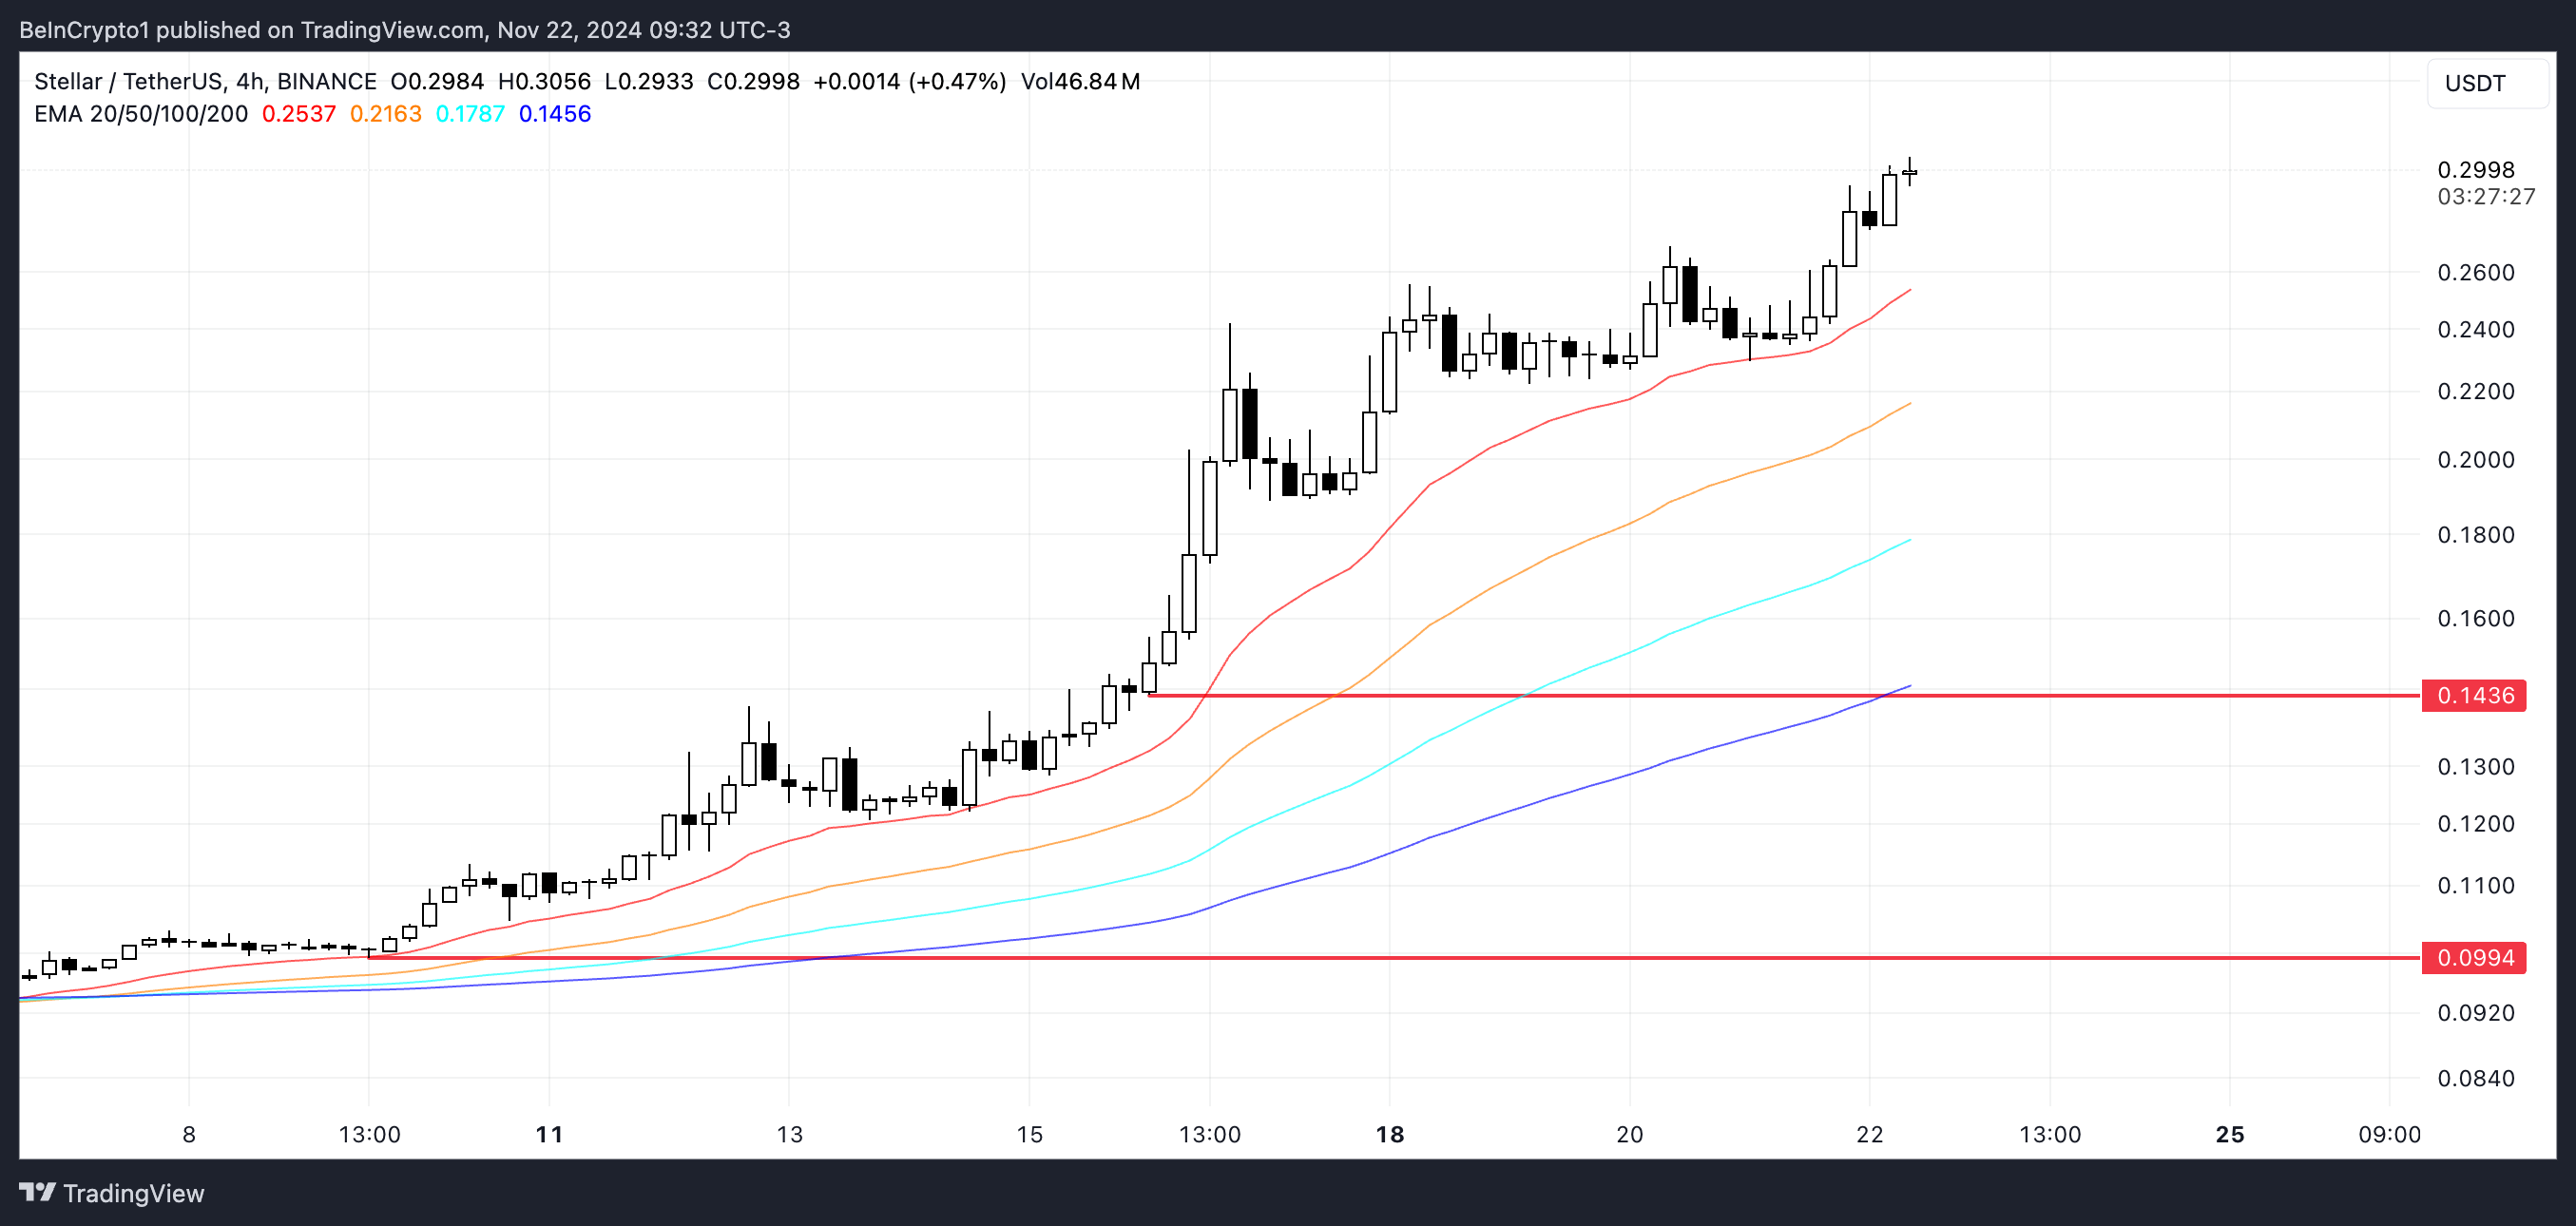
Stellar (XLM) price has surged more than 20% in the last 24 hours and is up an impressive 124.86% over the past seven days, reaching $0.30, its highest price since December 2021. This rapid ascent reflects strong bullish momentum, supported by key indicators like RSI, which remains in the overbought zone.
However, the relatively weak CMF suggests that the current trend may not yet have the strength to sustain further gains without renewed capital inflows. Whether XLM can push toward a $10 billion market cap or face a potential correction will depend on how well it holds key support levels in the days ahead.
XLM RSI Is In The Overbought Zone
Stellar RSI is 74.10, rising sharply from below 60 just a day ago. This increase signals strong bullish momentum, pushing XLM into the overbought zone, where RSI values above 70 indicate heightened buying activity.
While an RSI above 70 often suggests that a correction could be on the horizon, it also reflects strong market enthusiasm driving the current uptrend.

The RSI measures the speed and magnitude of price movements, with values above 70 signaling overbought conditions and below 30 indicating oversold levels. Historically, Stellar has experienced periods where its RSI remained above 70 for several days, during which the price continued to climb before eventually correcting.
This suggests that while caution is warranted, the current overbought conditions do not necessarily mean an immediate reversal, as the rally could still have room to grow before cooling off.
Stellar CMF Is Positive But Not That Strong Yet
XLM currently has a CMF of 0.06, recovering from -0.10 just one day ago. This shift into positive territory indicates an inflow of capital back into the asset, suggesting renewed buying pressure after recent selling activity.
However, the relatively low CMF value highlights that the inflow is not yet as strong as it was during earlier periods of significant bullish momentum.

The Chaikin Money Flow (CMF) measures the volume and direction of money flow, with positive values indicating capital inflows (bullish) and negative values reflecting outflows (bearish).
While XLM’s CMF turning positive is a good sign for its short-term trend, it remains far below the levels seen in mid-November when the CMF peaked at 0.40 and stayed above 0.10 for almost a week.
XLM Price Prediction: Can Stellar Reach The $10 Billion Market Cap Threshold?
If Stellar maintains its current uptrend, it could rise further to test a market cap of $10 billion. Achieving this milestone would require a 15.7% increase in XLM price, signaling continued strong bullish momentum and renewed investor interest.
However, as indicated by the relatively weak CMF, the current trend may lack the strength to sustain this upward trajectory.

If the trend reverses, XLM price could first test its strongest nearby support at $0.14. Should this level fail, Stellar price could drop further to $0.0994, representing a steep 67% correction from recent highs.
Disclaimer
In line with the Trust Project guidelines, this price analysis article is for informational purposes only and should not be considered financial or investment advice. BeInCrypto is committed to accurate, unbiased reporting, but market conditions are subject to change without notice. Always conduct your own research and consult with a professional before making any financial decisions. Please note that our Terms and Conditions, Privacy Policy, and Disclaimers have been updated.


