in 20 Minutes, Something Is Brewing")


Key takeaways:
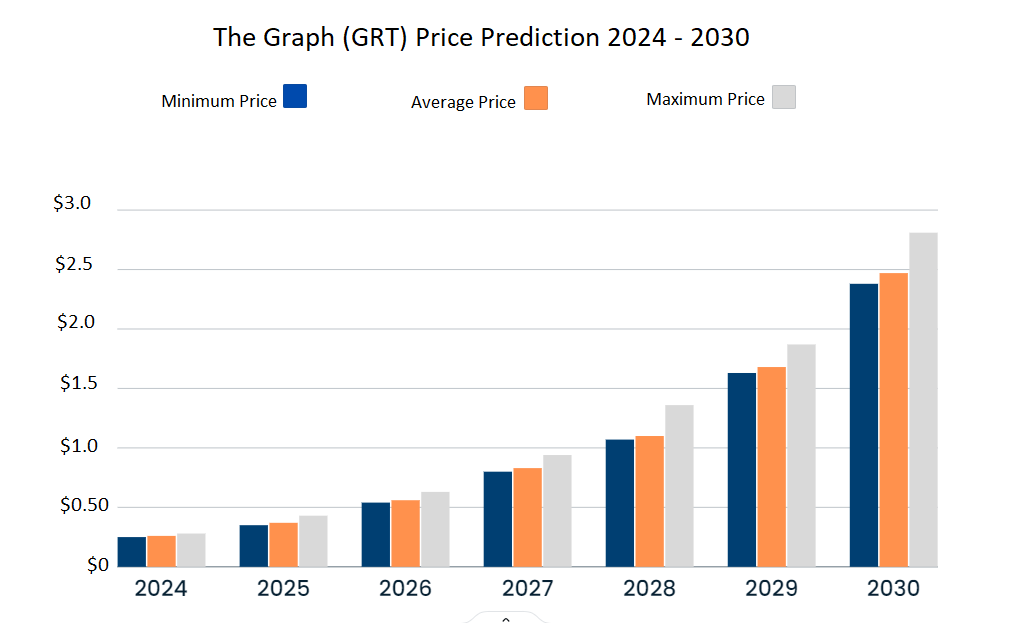
- The Graph price prediction anticipates a high of $0.2811 by the end of 2024.
- In 2027, it will range between $0.8000 and $0.9469, with an average price of $0.8283.
- In 2030, it will range between $2.38 and $2.81, with an average price of $2.47.
The Graph offers access to competitive and cost-efficient decentralized data sets.
The network boasts a 99.99% uptime and 24/7 availability. Central to The Graph’s operations are subgraphs, APIs that organize and serve blockchain data to data consumers and developers.
The Graph has over 100 indexer nodes, 1.23 trillion served queries, and over 70,000 hosted projects. The GRT token acts as an incentive mechanism for the Graph Network. It incentivizes network participants to provide data to end users and organize it effectively.
So, how high will GRT go? Is it a good investment? What will be its price in 2025? The following sections explore these questions and more.
Overview
| Cryptocurrency | The Graph |
| Ticker | GRT |
| Current price | $0.1605 |
| Market cap | $1,531,597,264 |
| Trading volume | $32,955,159 |
| Circulating supply | 9,548,531,509 GRT |
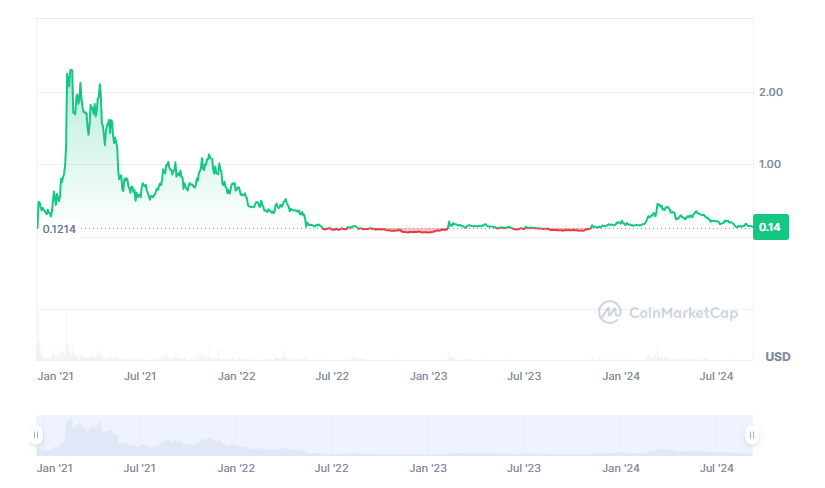
| All-time high | $2.88 on Feb 12, 2021 |
| 24-hour high | $0.1667 |
| 24-hour low | $0.1569 |
The Graph price prediction: Technical analysis
| Metric | Value |
| Volatility (30-day variation) | 7.07% |
| 50-day SMA | $ 0.16563 |
| 200-day SMA | $ 0.245868 |
| Fear and greed index | 29 (Fear) |
| Green days | 16/30 (53%) |
| Sentiment | Bearish |
The Graph price analysis: GRT devalues to $0.1605 amidst descent
Key takeaways:
- The Graph price analysis confirms a downtrend at $0.1605.
- The GRT coin has lost up to 2.25% of value today.
- The Graph prices are seeking resistance around $0.1639.
On September 22, 2024, The Graph price analysis revealed a downward trend for the cryptocurrency today. Coin value has dropped down to $0.1605 in the past 24-hours. However, the GRT coin has devalued up to 2.25% of value during the day. As the overall market sentiment remains negative, this creates uncertain circumstances for the investors regarding the coming market events.
The Graph 1-day chart analysis
The 1-day price chart of The Graph confirms a downward trend for the cryptocurrency. Coin value has receded to $0.1605 amidst the growing downside. If we talk about the overall market sentiment, then it remains on the negative side as well. As the volatility is expanding, there is a higher chance of reversal in the market events soon.
The gap between the Bollinger bands defines market volatility. As this area is currently expanding, this indicates an increasing volatility. Currently, the upper end of the Bollinger bands indicator, acting as the resistance band, is at $0.1639. Whereas, the lower end of the Bollinger bands indicator, serving as the support, is at $0.1246.

The Relative Strength Index (RSI) indicator is present within the neutral region. Its value has dropped down to 58.21. The RSI graph displays a steep bearish slope on the 1-day price chart. This signifies that the selling activities are dominating over the buying activities. Moreover, this decline indicates an instability within the crypto market.
The Graph 4-hour chart analysis
The four-hour price analysis of The Graph confirms an increasing trend for the currency. Coin value has improved up to $0.1605 in the past four hours. That is because the bulls have bounced back once again, leading to a rising buying pressure. Considering the earlier decline, the price has moved below its moving average level.
The area between the Bollinger bands is declining, leading to a decreasing volatility. The deteriorating volatility levels indicate a lower market unpredictability for now. Moreover, the upper end of the Bollinger bands indicator, acting as resistance, is present at $0.1670. Conversely, the lower end of the Bollinger bands indicator, serving as support, is at $0.1541.

The RSI indicator is present within the neutral region. Currently, at 56.79, and still moving upward, this indicates a bullish trend. Moreover, the rising buying pressure indicates stability within the market. The ascending curve on the RSI graph signals a balanced trading environment, and a positive scenario for the cryptocurrency buyers.
The Graph technical analysis: Levels and action
Daily simple moving average (SMA)
| Period | Value ($) | Action |
| SMA 3 | 0.138293 | SELL |
| SMA 5 | 0.138711 | SELL |
| SMA 10 | 0.145957 | SELL |
| SMA 21 | 0.153099 | SELL |
| SMA 50 | 0.16563 | SELL |
| SMA 100 | 0.199677 | SELL |
| SMA 200 | 0.245868 | SELL |
Daily exponential moving average (EMA)
| Period | Value ($) | Action |
| EMA 3 | 0.147819 | SELL |
| EMA 5 | 0.146302 | SELL |
| EMA 10 | 0.145238 | SELL |
| EMA 21 | 0.151393 | SELL |
| EMA 50 | 0.174228 | SELL |
| EMA 100 | 0.203654 | SELL |
| EMA 200 | 0.218503 | SELL |
Is The Graph a good investment?
The Graph rivals some Web2 data oracles for its efficiency and low costs. GRT, its native token, however, remains a victim of general market dynamics and high volatility. The current sentiment is bearish, with predictions pointing to higher price growth.
What can we expect from GRT price analysis next?
The Graph price analysis for the day gives out a highly bearish prediction regarding the ongoing price movements. Coin value has depreciated to $0.1605 low in the past 24-hours. The cryptocurrency has lost up to 2.25% of value during the day. If the selling activities intensify further, the cryptocurrency may experience further loss. Technical indicators are giving out a neutral signal, however; the price charts continue to support the bears.
Why is GRT down?
The Graph has returned to the highest trading levels of this year, the crypto market capitalization is also at its highest. The increase in the Graph’s value could be attributed to the general bullish market sentiment. However, the past few weeks proved to support the bears, as the selling pressure remained substantially high.
Will GRT recover?
The Graph is recovering this month, and the current resistance could be crucial to sending GRT to previous highs.
Will GRT reach $1?
Yes, GRT should rise above $1 in 2027. In that year the price will range between $0.8744 and $1.03.
WIll GRT reach $10?
According to the Cryptopolitan price prediction, it remains unlikely that GRT will get to $10 before 2030.
WIll GRT reach $100?
Per the Cryptopolitan price prediction, it remains highly unlikely that GRT will get to $100 before 2030.
Does GRT have a good long-term future?
Per the Cryptopolitan price predictions, GRT is set to trade higher in years to come. However factors like market crashes or difficult regulations could invalidate the bullish theory.
Recent news/ opinions
- Marian Walter from The Graph Protocol discussed on chain data issues in infrastructure development in a Spaces session with Azuro Protocol.
- The Graph Network said users can increase the efficiency of their subgraphs and decentralized apps’ performance with a new feature that helps reduce excess queries at low activity times.
The Graph price prediction September 2024
A break above resistance is critical to ending The Graph’s bear run this month. The price will range between $0.1247 and $0.1732 and average at $0.1489.
| Month | Potential low ($) | Potential average ($) | Potential high ($) |
| September | 0.1247 | 0.1489 | 0.1732 |
GRT price prediction 2024
As the third quarter of 2024 unfolds, GRT will likely recover to previous highs. The coin will trade between $0.2485 and $0.2811. The average price will be $0.2598
| Year | Potential low ($) | Potential average ($) | Potential high ($) |
| 2024 | 0.2485 | 0.2598 | 0.2811 |
GRT price prediction 2025-2030
| Year | Potential low ($) | Potential average ($) | Potential high ($) |
| 2025 | 0.3598 | 0.3702 | 0.4261 |
| 2026 | 0.5497 | 0.5645 | 0.6310 |
| 2027 | 0.8000 | 0.8283 | 0.9469 |
| 2028 | 1.07 | 1.10 | 1.36 |
| 2029 | 1.63 | 1.68 | 1.87 |
| 2030 | 2.38 | 2.47 | 2.81 |
The Graph price prediction 2025
The Graph price forecast for 2025 sets the high at $0.4261. However, in the case of a market correction, the GRT price will rest at a minimum of $0.3598 and an average of $0.3702.
The Graph price prediction 2026
The year 2026 will experience more bullish momentum. As per the Graph GRT price prediction, it will range between $0.5497 and $0.6310, with an average trading price of $0.5645.
The Graph price prediction 2027
The Graph prediction climbs even higher into 2027. According to the prediction, it will range between $0.8000 and $0.9469, with an average price of $0.8283.
The Graph GRT price prediction 2028
The analysis suggests a further acceleration in GRT’s growth by 2028. As per the GRT price prediction, the price of The Graph will range between $1.07 and $1.36, with an average of $1.10.
The Graph price prediction 2029
According to the GRT price prediction for 2029, GRT’s price will reach a maximum and minimum of $1.87 and $1.63, respectively, with a year-round average of $1.68.
GRT price prediction 2030
The Graph for 2030 suggests a price range of $2.38 and $2.81 and an average price of $2.47. This long-term prediction hinges on GRT’s rising global adoption and recognition. Demand surges as more users and systems incorporate the GRT token, increasing its value.
The Graph Market price prediction: Aalysts GRT price forecast
| Platform | 2024 | 2025 | 2026 |
| Digitalcoinprice | $0.38 | $0.45 | $0.67 |
| Changelly | $0.41 | $0.39 | $0.57 |
| Gate.io | $0.26 | $0.28 | $0.29 |
Cryptopolitan’s GRT price prediction
Our predictions show that GRT will achieve a high of $0.2811 in the second half of 2024. In 2025, it will range between $0.3598 and $0.4261, with an average of $0.3702. In 2030, it will range between $2.38 and $2.81, with an average price of $2.47. Note the predictions are not investment advice. Seek independent professional consultation or do your own research.
The Graph historic price sentiment
- Yaniv Tal, Brandon Ramirez, and Jennus Pohlman launched The Gaph on the Ethereum blockchain in 2018.
- In June 2020, The GRaph held its private token sale, raising $5 million. Some participants included Multicoin Capital, Digital Currency Group, and DTC Capital.
- The public sale, which took place in October 2020, raised $12 million. Each token sold for $0.03. The mainnet launched in December 2020.
- In January 2021, another sale led by Tiger Global Management raised $50 million.
- Looking back, GRT had its best performance in 2021, when it registered its all-time high at $2.88 on February 12, 2021.
- In Feb 2022, venture capital firms DCG, Milticoin Capital, NGC ventures, Gumi Cryptos Capital, and Hashkey announced the launch of a $205 million ecosystem fund, The Graph Protocol.
- In preceding years, GRT consistently traded below $0.7. In 203, it fell below $0.2 as per historical data.
- GRT started recovering in 2024, breaking above $0.4 at its highest, reaching $0.45 in March. It later corrected, and in July, it fell below $0.20.
- At the start of August 2024, GRT/USD dipped to $0.1280 but it spiked up to $0.1767 by August 24, before dipping once again to $0.1300 level in September.