


Bitcoin’s price experienced a notable drop, falling from a daily high of $27,500 to $26,500 after the Federal Reserve announcement. This decline has sparked concerns and fears among traders and investors, reviving speculation about the possibility of Bitcoin dropping to $20,000.
Such sharp price drops in Bitcoin and other cryptocurrencies often lead to extreme fear and uncertainty in the market, as bears aim to sow doubt and hesitation among investors. The week initially seemed promising for Bitcoin and cryptocurrencies, with Bitcoin’s price rising from $25,800 to $27,500. Many hoped for Bitcoin to close above this level and establish strong support above $28,500 as resistance.
However, this positive momentum was short-lived as bears pushed the price down to around $26,500, and Bitcoin struggled to maintain this level or retest the previous lows of $24,800 to $23,500.
Bitcoin’s fear and greed index appears more promising this week compared to previous months, with the current index at 47, indicating a neutral sentiment, which is a positive sign for BTC.
The cryptocurrency market, including the top 5 cryptocurrencies for the week (XRP, SOL, LINK, ADA, PEPE), is showing positive signs, as highlighted in the heat map.
Bitcoin’s price experienced a rally from $25,500 to $27,500 but faced resistance at $27,500, leading to speculation of a potential bearish trap by bears. Bitcoin is trading below the 50-day and 200-day Exponential Moving Average (50-day and 200-day EMAs), with $27,500 acting as resistance.
To trigger a bullish rally, Bitcoin needs to surpass and close above the $27,500 to $28,500 range. Failure to do so could result in a push by bears to drive the price down to $23,800.
Bitcoin has been range-bound between $25,500 and $27,500 for over a month, and a breakout in either direction could provide opportunities for traders and investors.
Ethereum is also facing challenges, with its price below the 50-day and 200-day EMAs, hovering around $1,650. Ethereum’s price action suggests a potential retest of the $1,500 to $1,450 range.
Despite the price struggles of Bitcoin and Ethereum, there is speculation surrounding the top 5 cryptocurrencies for the week (XRP, SOL, LINK, ADA, PEPE), and there is potential for significant price changes in the coming week.
1. Ripple’s XRP: Steady Price Movement, Hopes for a Bullish Breakout
Ripple is maintaining a steady course with its XRP cryptocurrency, experiencing range-bound price movements for over a month. The price dropped to a key support level of $0.46 but quickly rebounded to reach $0.50, as bullish investors hope for a breakout.
Despite facing legal challenges from the United States Security Exchange Commission (US SEC), Ripple remains one of the most discussed cryptocurrencies in the weekly top 5. It enjoys strong community support, and this year saw positive developments after winning a legal case, propelling its price to $0.93. However, it has since faced challenges from bearish market conditions.
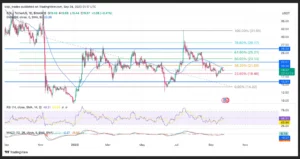
Currently, the price of XRP/USDT is trading just below the 50-day Exponential Moving Average (EMA), which acts as a resistance level. If the price fails to rise above $0.55, there is a possibility of it remaining in the current range and potentially retesting the $0.46 support zone.
If the bulls manage to reclaim the XRP/USDT price above the 23.6% Fibonacci Retracement Value (23.6% FIB Value), it could open up an opportunity for a price push towards the $0.65 to $0.7 range.
Additionally, if the XRP/USDT price climbs above $0.55, it may trigger several bullish moves. The daily Moving Average Convergence Divergence (MACD) could switch to a bullish trend, and there might be an increase in buy actions on the Relative Strength Index (RSI).
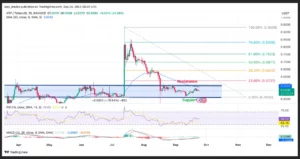
2. Chainlink (LINK) Targets $15 After Year-Long Price Range
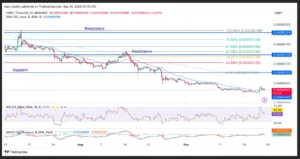
LINK USDT 1D PRICE CHART 24SEP23
Chainlink (LINK) has emerged from a 450-day-long price range between $6 and $9, igniting hopes of a substantial rally in the coming weeks. If LINK can break above $9, enthusiastic bulls, often referred to as “LINK marines,” could potentially drive the price to $12 or even $15.
Despite its extended bearish phase, Chainlink (LINK) enjoys strong community support and remains committed to development efforts.
The LINK/USDT price chart suggests favorable conditions for an upcoming rally. Bulls may seize control as the price currently trades above the 50-day EMA, with encouraging signals from the daily MACD and RSI indicators.
Having reclaimed the price level above the 23.6% Fibonacci Retracement Value (23.6% FIB Value), LINK/USDT is positioned well for a rally. To solidify the bullish momentum, LINK/USDT needs to break out and maintain levels above $9.
A successful breakout above $9 is pivotal for the anticipated rally, potentially propelling LINK to $12 and even $15. Conversely, if LINK/USDT fails to surpass the $9 threshold, the price may continue to move within its current range-bound pattern.
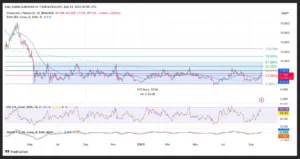
3. Solana (SOL) Price Faces Uncertainty After Court-Ordered FTX Asset Sale
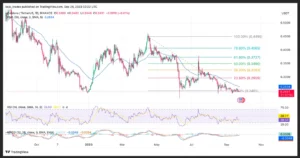
SOL USDT PRICE CHART 24SEP23
Solana’s (SOL) price experienced significant turbulence following a court-ordered sale of FTX assets valued at over $3.4 billion. This event triggered apprehension among investors and traders, with concerns that SOL/USDT might plummet to its yearly low of $8.5.
The price of SOL/USDT endured a dramatic drop from its recent peak of $24 to the $17.5 range, which served as robust support, stemming from a prior price decline. SOL/USDT briefly rallied to $20.5, encountering resistance that prevented further upward movement.
Currently, SOL/USDT is trading below the 50-day EMA, which acts as a resistance level. To regain bullish momentum, the price must break out and sustain levels above $20.5, aligned with the 38.2% Fibonacci Retracement Value (38.2% FIB Value).
A successful breakout and closure above $20.5 could provide an opportunity for bulls to propel the price to highs of $25 to $26, contingent on trading volume.
The MACD and RSI indicators for SOL/USDT on the daily timeframe suggest reduced activity. The upcoming week is expected to play a crucial role in SOL’s price prospects as it attempts to breach the $20.5 resistance level.
4. Cardano (ADA) Faces Potential Further Declines as Price Hits Alarming Lows
ADA USDT PRICE CHART 24SEP23
Cardano (ADA) is currently grappling with a severe price downturn, causing significant losses for its holders. The optimism surrounding ADA/USDT retesting $1 in 2024 is now clashing with the grim reality.
Following its surge to a yearly high of $0.45, the price of ADA/USDT has experienced substantial declines, reaching as low as $0.245. This price level has emerged as a crucial demand zone for traders and investors.
However, if ADA/USDT fails to maintain its position above $0.245, it could potentially plummet to a new low, possibly around $0.15, raising concerns among traders and investors.
Multiple factors, including indicators like MACD and RSI, trading volume, and price movements, all point toward bearish dominance in ADA/USDT. Currently, there are no discernible signs of bullish intervention to rescue the price from further declines.
5. PEPE Faces Significant Price Declines Amidst Bearish Pressure
PEPE USDT PRICE CHART 24SEP23
PEPE, despite its considerable hype and publicity, has witnessed substantial price declines, leaving traders and investors without clear indications of strong support or demand zones.
The allure of potential riches has drawn numerous individuals to invest in this new memecoin, which reflects the broader trend of memecoins becoming an essential part of cryptocurrency trading.
After reaching an all-time high of $0.0000040, the price of PEPE/USDT experienced a decline, with bears exerting downward pressure. Although a support level initially formed around $0.00000150, the price has since fallen below this point, rendering it a resistance level.
Currently, PEPE’s price hovers below $0.000000700, with an emphasis on establishing a robust support zone to facilitate buy orders and drive the price higher. However, indicators like MACD and RSI for PEPE/USDT strongly signal bearish dominance in its price movements.
Important: Please note that this article is only meant to provide information and should not be taken as legal, tax, investment, financial, or any other type of advice.
Join Cryptos Headlines Community
Follow Cryptos Headlines on Google News
Author