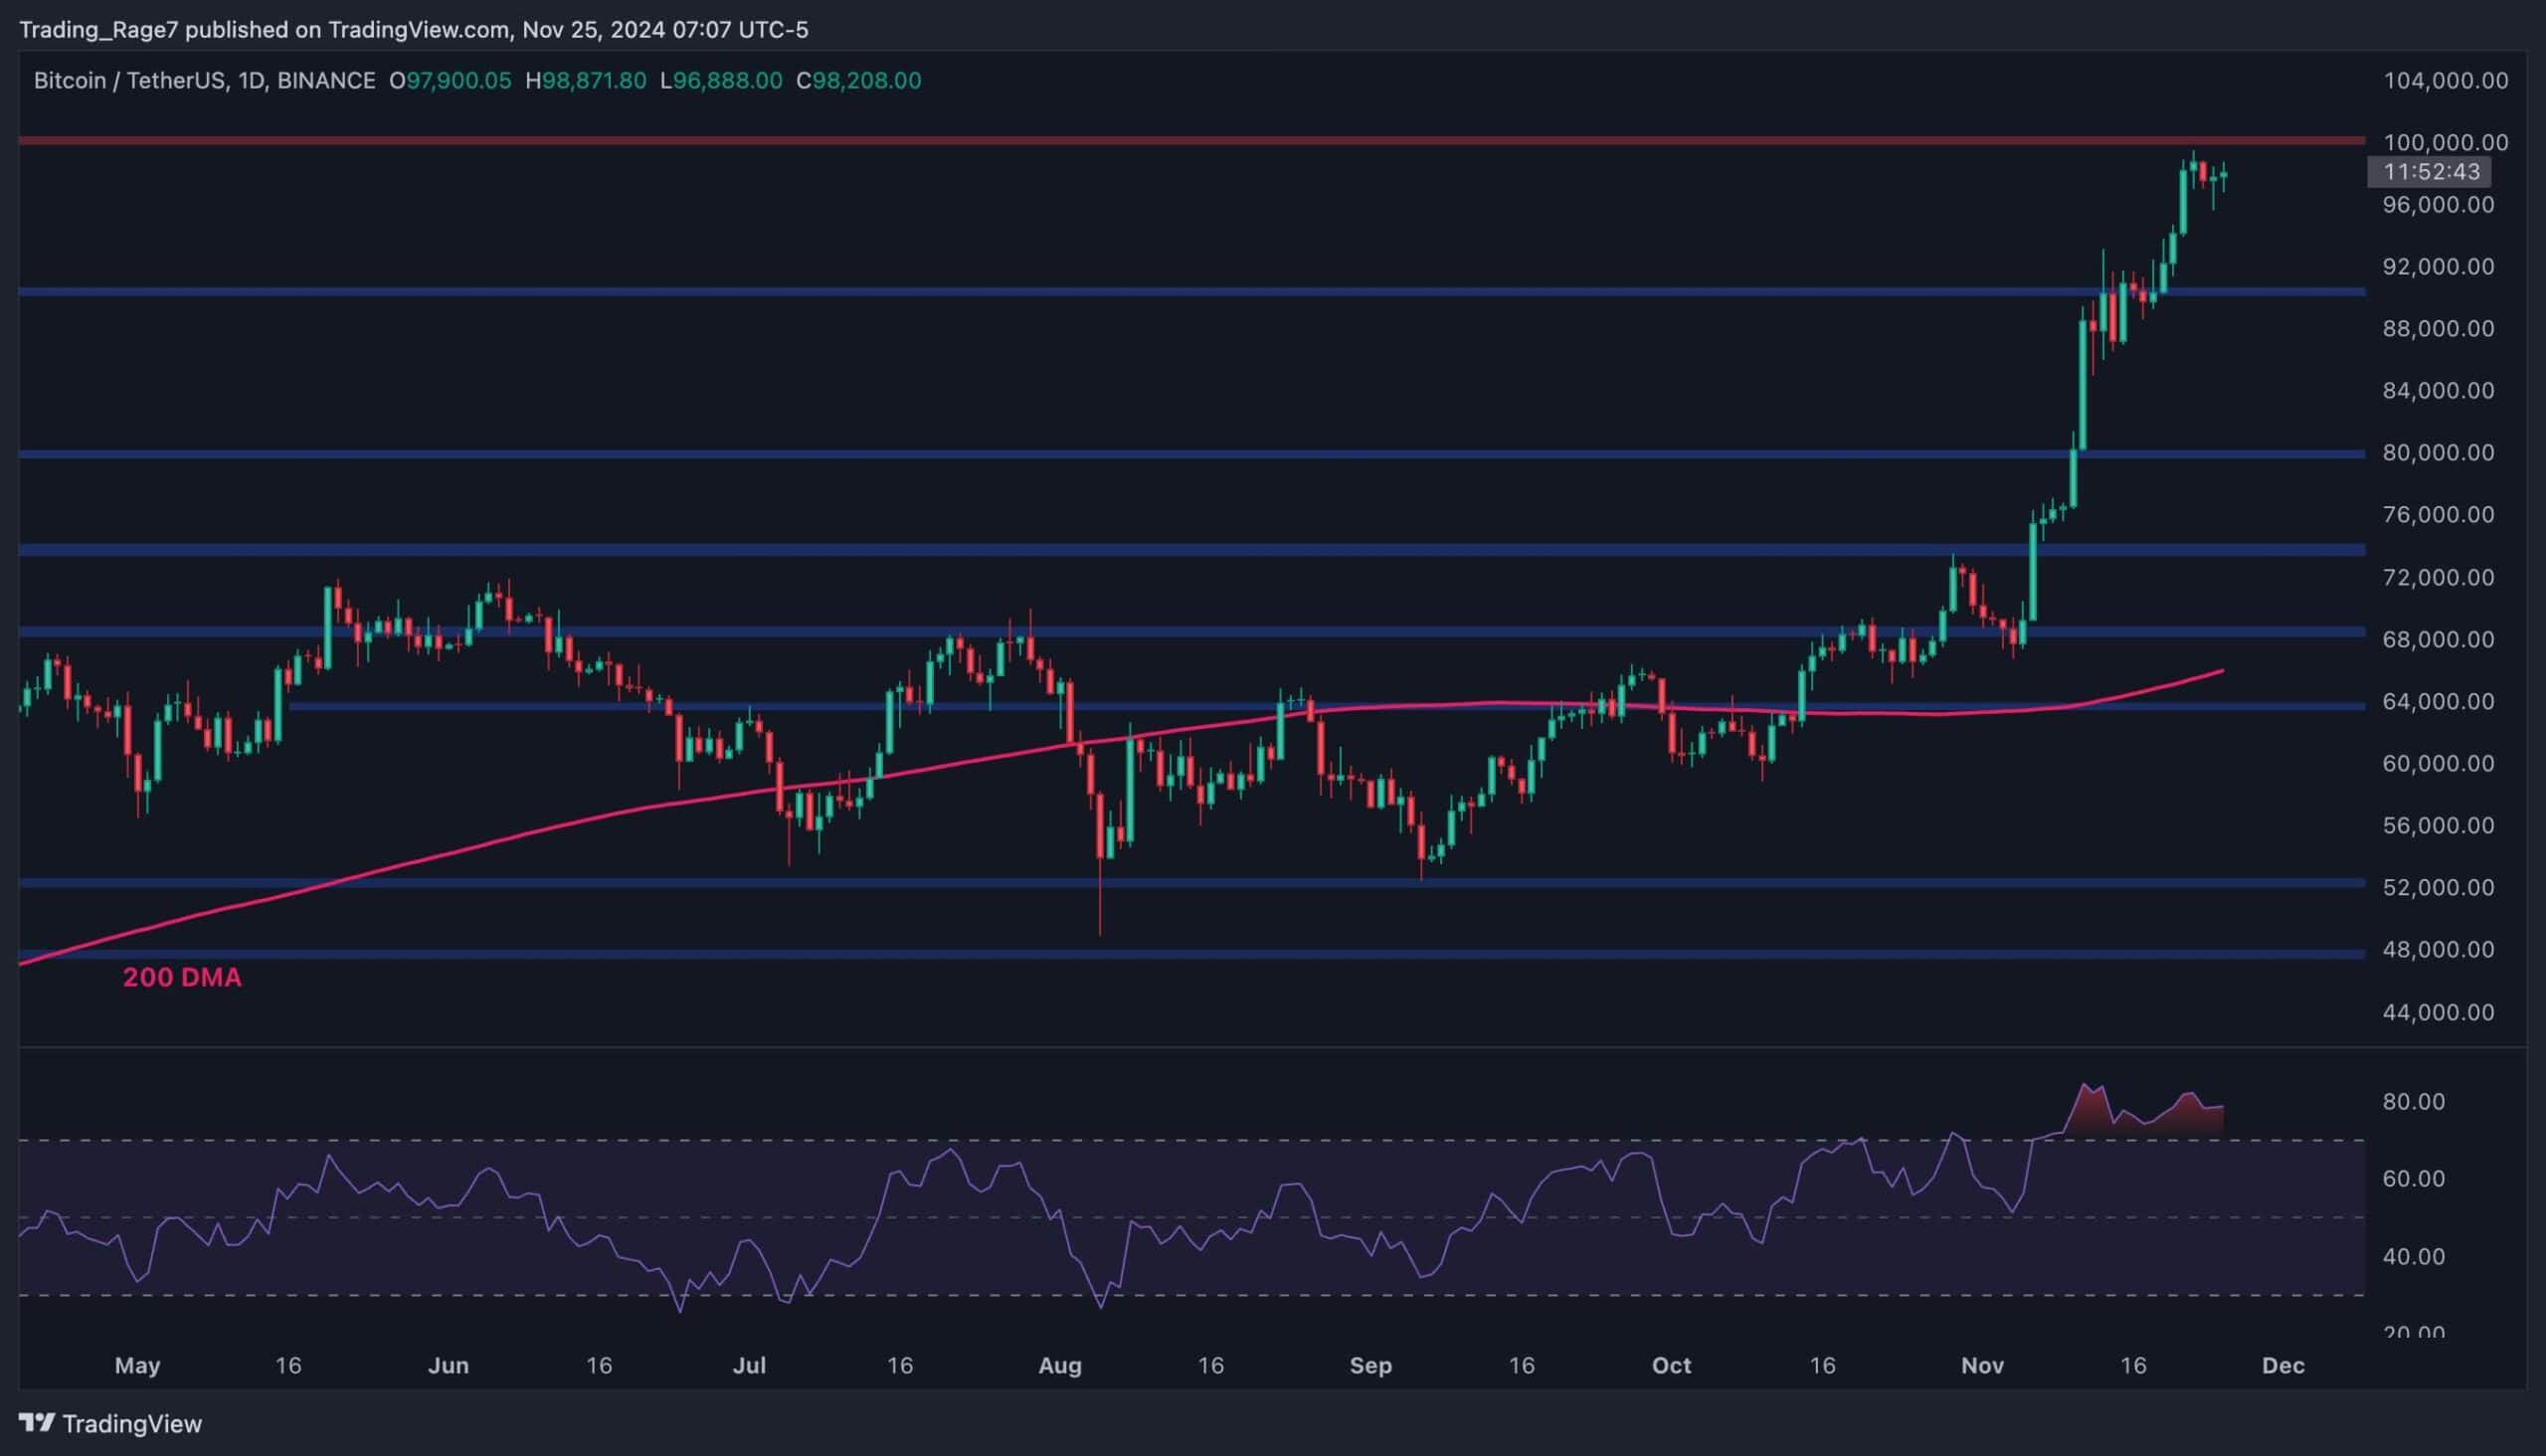
Analysts are signaling a critical moment for Bitcoin, with warning signs flashing on its charts. As Bitcoin attempts to retest crucial support levels, it faces potential liquidations. According to analyst Josh of Crypto World, the Bitcoin market is currently in a precarious position, with key support levels holding but facing pressure from bearish indicators.
Bitcoin Chart Overview
Four-Day Analysis
Looking at the four-day Bitcoin chart, the Super Trend indicator remains in the red, indicating bearish momentum. This aligns with the broader trend we’ve observed over the past six months.
Two-Day Trend
On the two-day chart, Bitcoin is trapped within a descending broadening wedge pattern, which suggests a longer-term bearish trend. To shift this trend into a bullish phase, Bitcoin needs to break above the resistance line around $66,000, ideally reaching $67,000 to $68,000.
Support and Resistance Levels
Currently, Bitcoin is retesting significant support between $60,200 and $61,200. If it breaks below $60,000 with a daily candle close, the next support levels are $59,500 and $58,000. Further downside could bring us to $56,000 to $57,000.
Should Bitcoin bounce off the current support, short-term resistance is expected around $63,000, with stronger resistance at $64,200 to $64,500. Even if Bitcoin breaks this resistance, we would still encounter strong barriers at $67,000 to $68,000.
Liquidation Heat Map
Recent market activity has seen the liquidation of positions between $61,300 and $61,700. Currently, Bitcoin is approaching a significant liquidity zone just below $60,000, which could be a target for further price action. If we see continued bearish momentum along with rising DXY, it could lead to more liquidations.


