
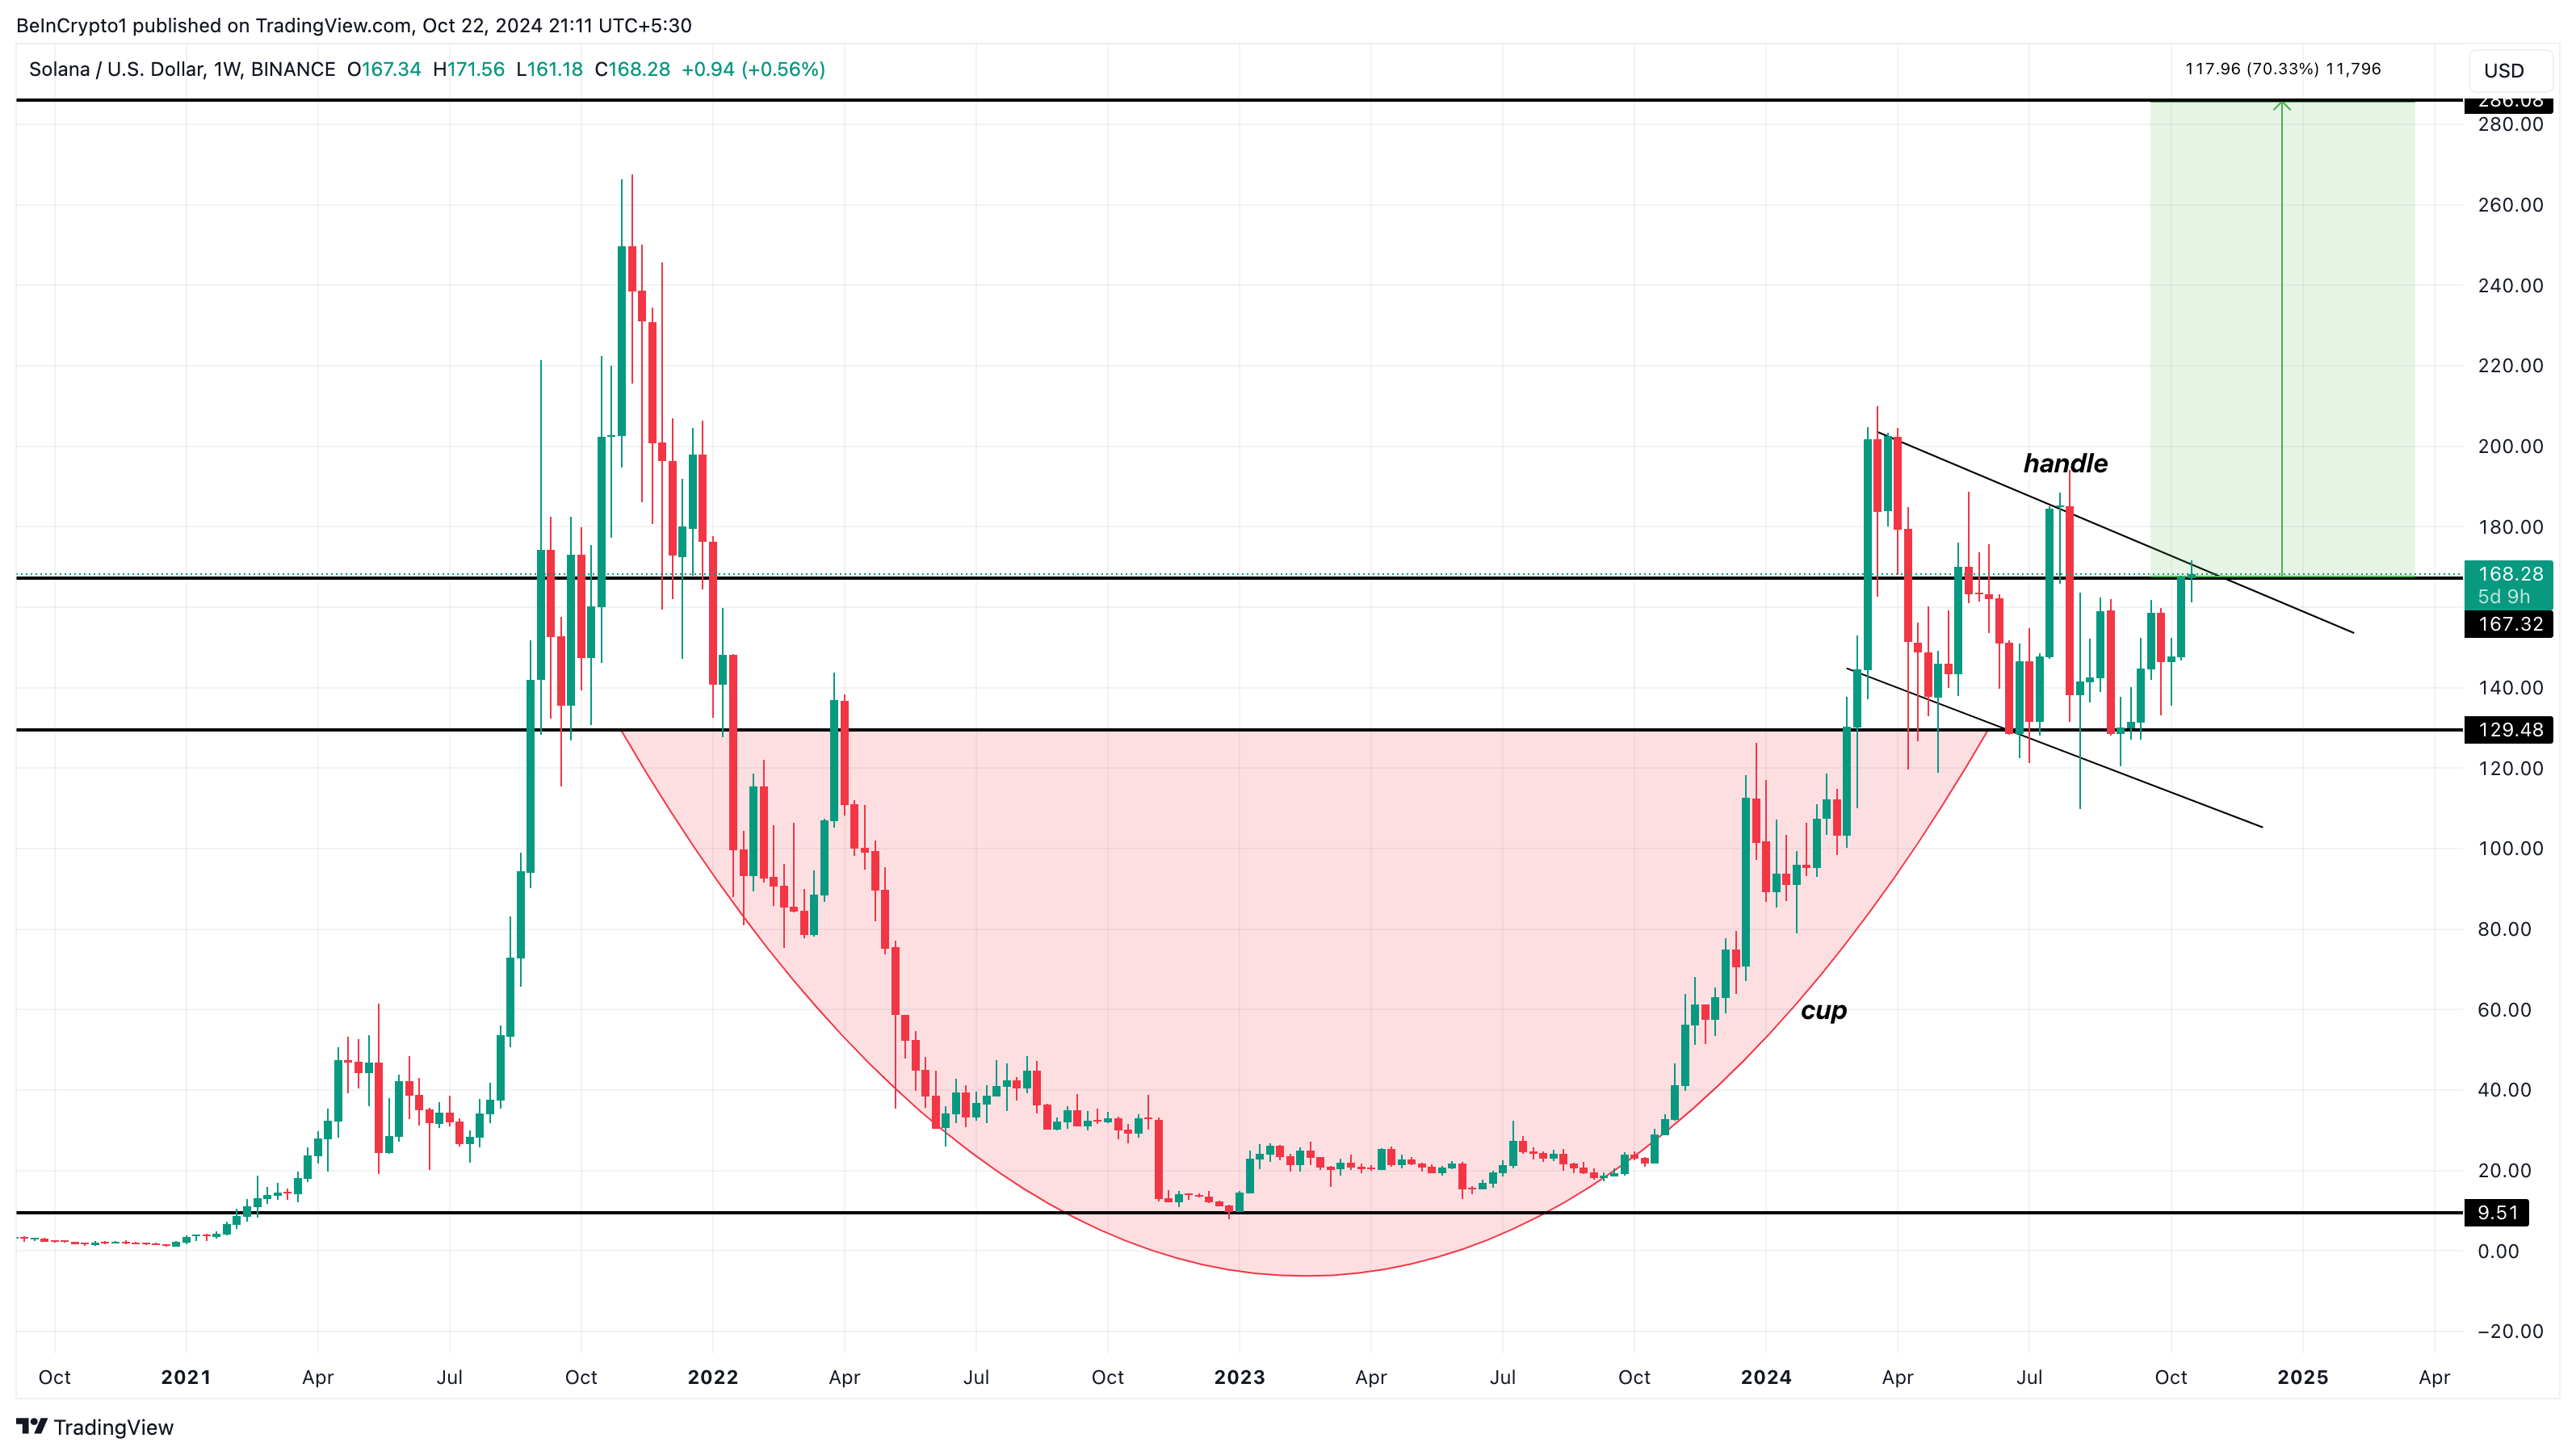
Solana’s (SOL) price chart shows that the altcoin could be on the verge of a 70% increase. In August, Solana’s price dropped to $130.
Today, it has climbed to $168, indicating that a potential breakout may already be underway. This analysis explains how SOL could rally beyond the current levels before the year ends.
Solana Forms Bullish Pattern on the Weekly Chart
According to the weekly chart, SOL has formed a cup-and-handle pattern. This figure appears when the price experiences a U-shaped recovery, resembling a “cup,” followed by a consolidation phase that looks like a “handle.”
Since March, SOL’s price has been consolidating between $127 and $201, indicating that the handle reflects indecision in choosing a specific direction. However, for the pattern to be validated, it has to break above the major neckline.
If this breakout occurs, the price could rise by an amount almost equal to the maximum distance between the cup’s trough and the neckline. For SOL, the token has broken above the neckline at $167. Therefore, the altcoin’s value might rise by 70% and possibly hit $285.
Read more: 7 Best Platforms To Buy Solana (SOL) in 2024
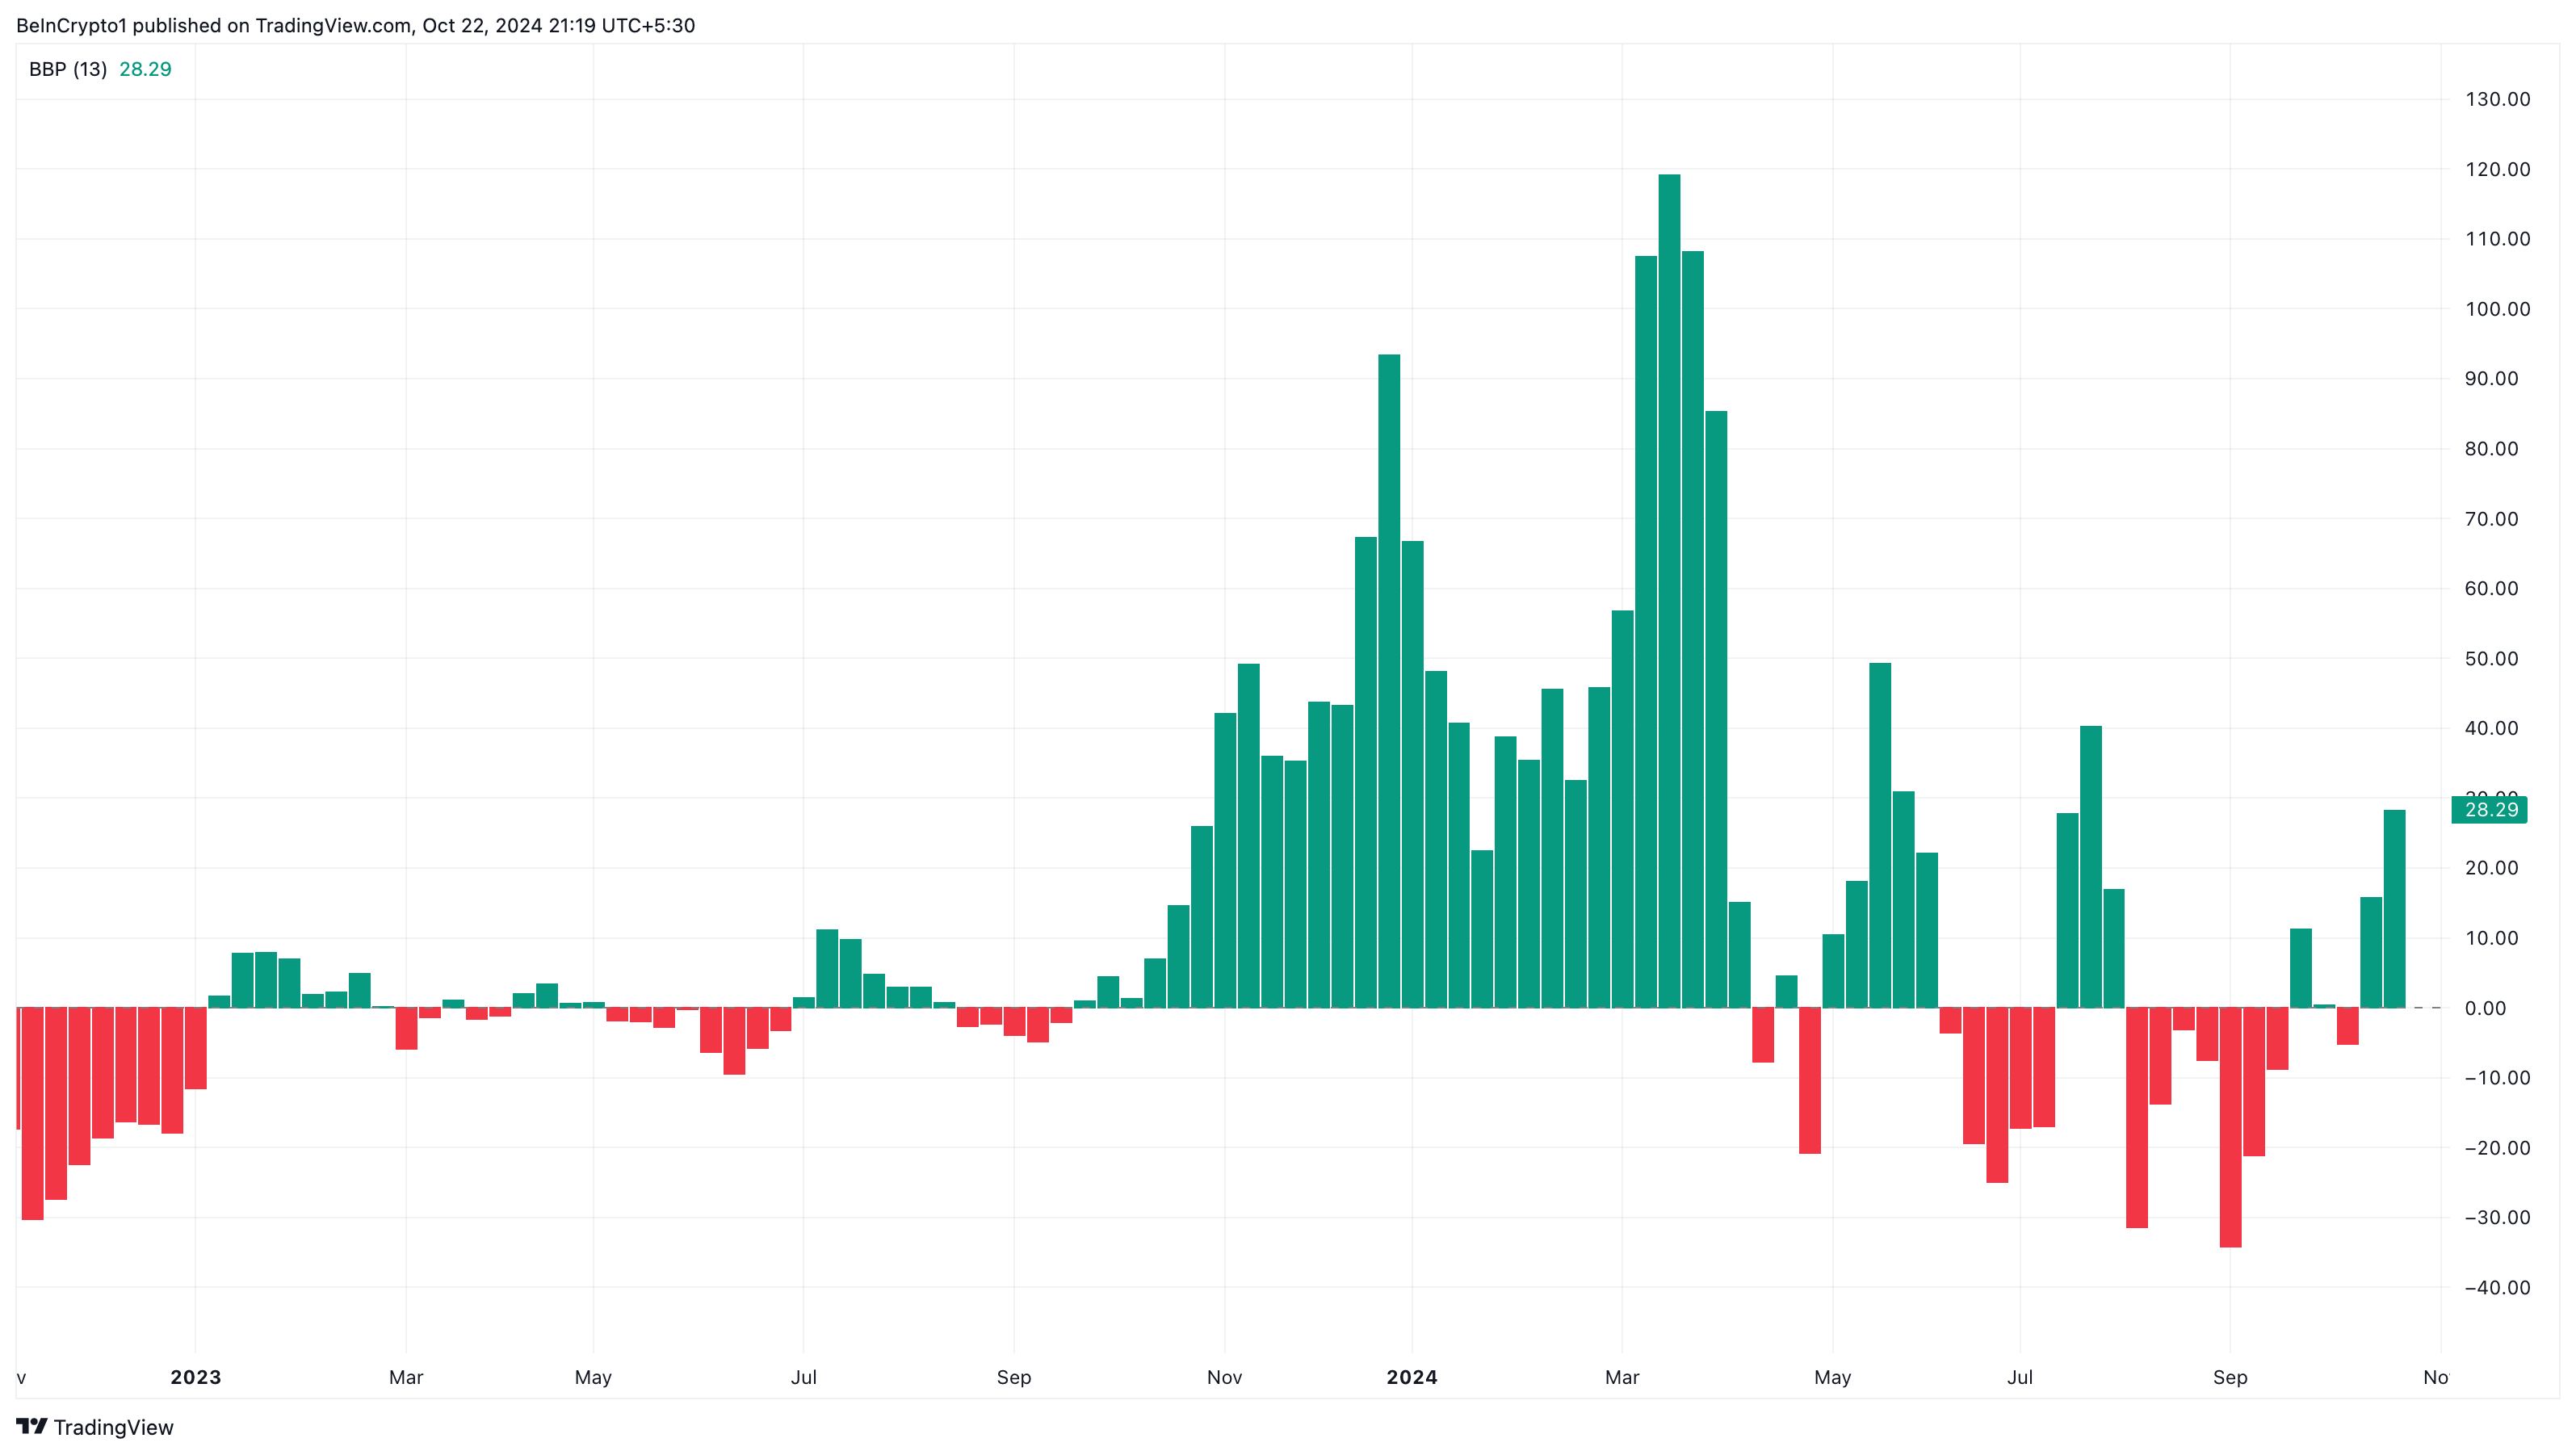
Besides this, the Bull Bear Power (BBP) on the chart shows that bulls are in control, and the prediction might come to pass. The BBP shows if the strength of buyers is stronger than those of bulls or if bears have the upper hand.
Typically, a negative reading means bears have more impact on the crypto’s price. A positive reading, on the other hand, indicates that bulls can push for a price increase, which is what appears to be in play.
Another factor that could positively influence Solana’s price is the increasing institutional adoption of the altcoin. Recently, asset management firm VanEck included staking for its Solana Exchange Traded Note (ETN) in Europe.
This move suggests that Solana might be the next in line for significant institutional interest, following the notable adoption of Bitcoin (BTC) and Ethereum (ETH).
SOL Price Prediction: Potential Rally to $176
From a short-term outlook, Solana’s price has bounced above the $155 support. A drop below this point could have triggered a notable correction for the cryptocurrency, but since it did not, SOL could move higher.
The Fibonacci retracement also appears to be supporting this move. Based on the Solana price chart below, if buying pressure increases, the altcoin could jump to the 78.6% Fibonacci retracement level. In that scenario, the token could hit $176.07, foreshadowing another hike toward $194.08.
Read more: Solana (SOL) Price Prediction 2024/2025/2030
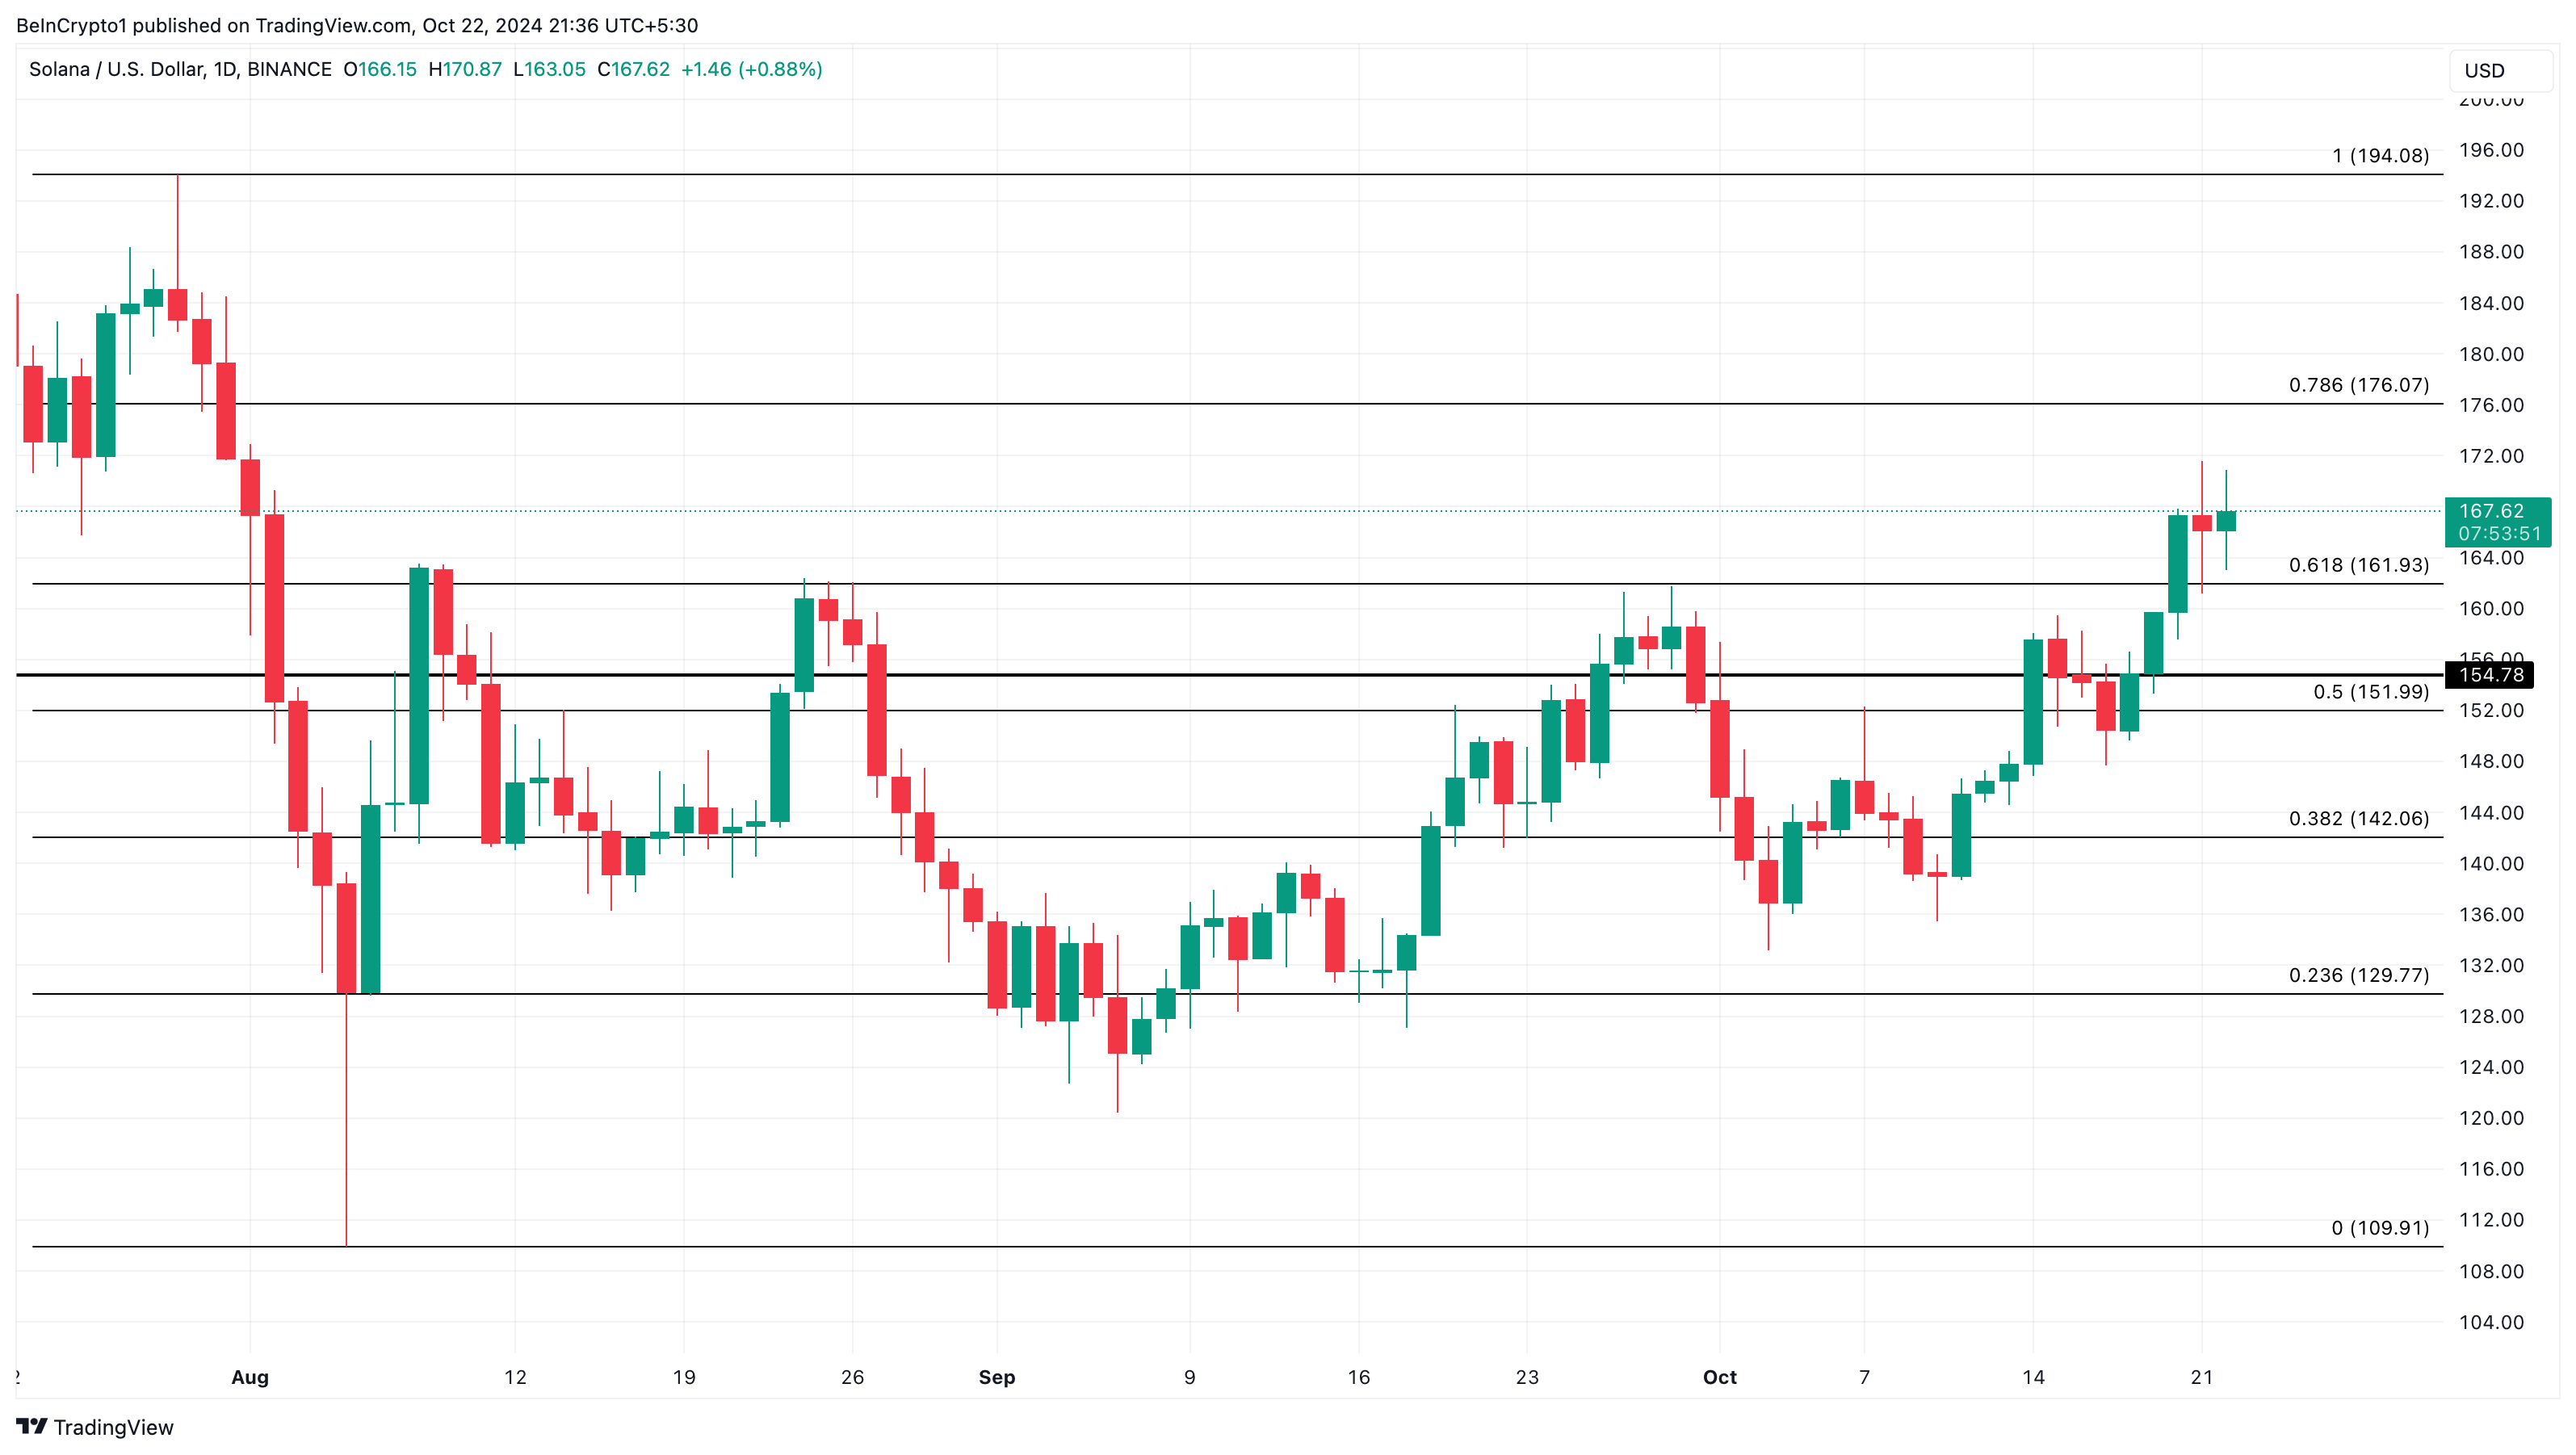
However, if the price drops below the 61.8% Fib level, the forecast might not come to pass. Instead, SOL could decline to $142.06.
Disclaimer
In line with the Trust Project guidelines, this price analysis article is for informational purposes only and should not be considered financial or investment advice. BeInCrypto is committed to accurate, unbiased reporting, but market conditions are subject to change without notice. Always conduct your own research and consult with a professional before making any financial decisions. Please note that our Terms and Conditions, Privacy Policy, and Disclaimers have been updated.