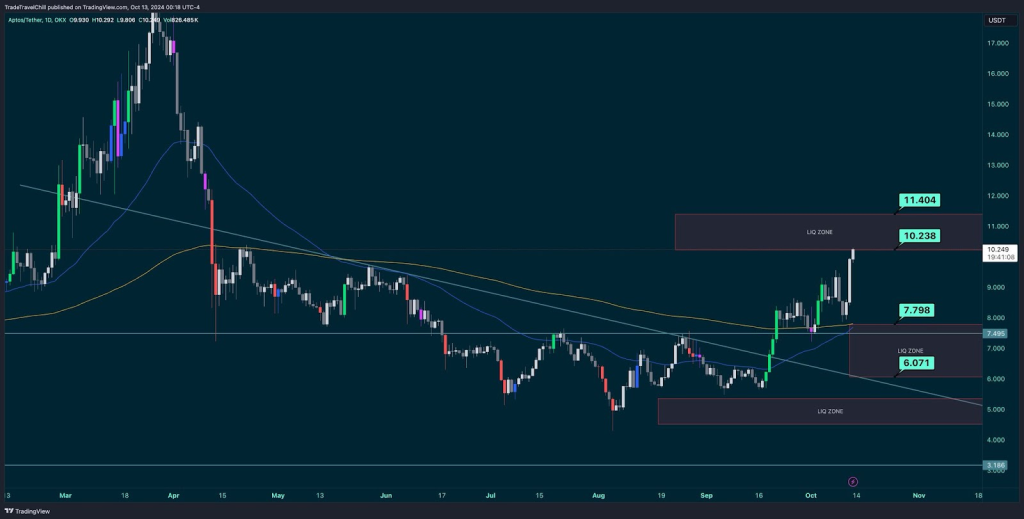

The Aptos (APT) price is up over 20%, and it is trading at over $10. It is currently the top gainer in the market. Additionally, there was a 133.98% increase in its trading volume, indicating that investors are purchasing APT.
However, this breakout from a long-standing downtrend has set the stage for further potential gains. But what is behind this price surge, and what can traders expect next?
Celebrate Dogecoin and Make Big Gains with Doge2014!
Doge2014 raises 500K in days celebrating Dogecoin. Make potentially big profits and get in on exclusive airdrop!
Show more +Aptos Price Breaks Key Resistance Levels
Aptos had been trading in a bearish descending channel for several months, with its price steadily declining. The downtrend saw APT’s price fall from its highs near $25 to around $4.20 by mid-August.
However, the APT chart analysis shows a sharp reversal when the price broke out of this channel in late August, signaling a change in momentum.
Since then, Aptos Price has gained nearly 60% in value, as noted by World Of Charts. Following the price’s recovery above $9, traders are closely monitoring resistance at $10.238 for further downside or further gains. After the breakout, the market’s attitude shifted from being negative to being positive.
Read Also: Elite Crypto Analyst Predicts Bitcoin Price Will Move ‘Significantly Up’ Next Week – Is an ATH Next?
Aptos Price Targets and Liquidity Zones
In another tweet, Trade Travel Chill highlighted that Aptos price reached the analyst’s $10 target with no signs of slowing down. The APT chart identifies key liquidity zones that have played a significant role in this rally. The liquidity reset around $6.071 acted as a base, allowing APT’s price to push higher, breaking key resistance levels.


The current liquidity zone near $10.238 presents a critical area of resistance. If the Aptos price breaks through this level, analysts predict a potential move toward the next resistance at $11.404. On the other hand, long-term traders may find buying chances on a retreat to support levels such as $7.798 or $6.071.
Moreover, the 50-day and 200-day moving averages are technical indicators that lend credence to the optimistic outlook. Aptos price is currently trading above both moving averages, suggesting that the rise might continue.
Furthermore, Aptos price movement over the 200-day moving average is considered a sign of optimism and a crucial indicator of the direction of the long-term trend.
As Aptos continues to show strong momentum, traders are watching key levels for further developments. The immediate resistance at $10.238 will be a crucial test, with a potential upside toward $11.404 if the bulls maintain control.
However, any pullback could see support levels around $7.798 coming into play. Analysts remain optimistic, with many looking for opportunities to add to their positions during any retracement.
Follow us on X (Twitter), CoinMarketCap and Binance Square for more daily crypto updates.
Get all our future calls by joining our FREE Telegram group.
We recommend eToro
Active user community and social features like news feeds, chats for specific coins available for trading.
Wide range of assets: cryptocurrencies alongside other investment products such as stocks and ETFs.
Copy trading: allows users to copy the trades of leading traders, for free.
User-friendly: eToro’s web-based platform and mobile app are user-friendly and easy to navigate.
Source link


