- Notcoin’s bullish falling wedge hinted at a 60% rally if it broke the crucial $0.0076 level.
- 79% whale control and low BTC correlation could amplify Notcoin’s potential upside breakout trajectory.
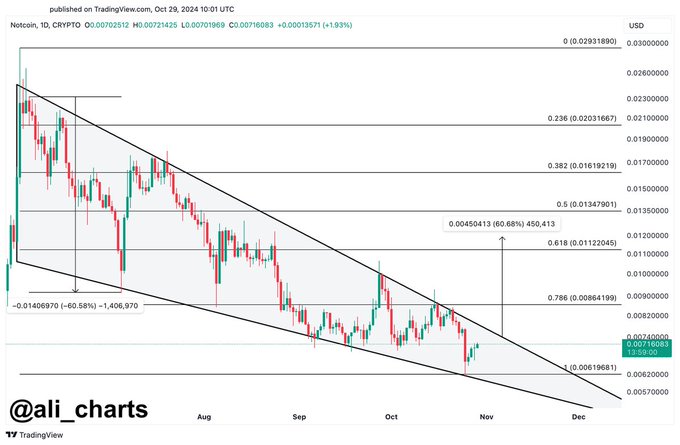
Notcoin [NOT] is forming a falling wedge pattern, a bullish reversal structure often characterized by converging downward trendlines. According to crypto analyst Ali, NOT could experience a 60% price surge if it breaks above the $0.0076 resistance level.
The wedge has been forming since early July, suggesting that the extended downtrend might be approaching its end.
If a breakout occurs above the upper trendline, the next potential resistance targets are identified using Fibonacci retracement levels.
Key levels to monitor include 0.236 at $0.0231667, 0.382 at $0.01619219, 0.5 at $0.01347901, 0.618 at $0.01122045, and 0.786 at $0.00864199.
The height of the wedge, measured at 0.00450413 or 60.68%, suggests a breakout target around the 0.618 Fibonacci level.
Current price and trading volume
As of press time, Notcoin (NOT) traded at $0.007009, reflecting a 1.68% decline over the past 24 hours and a 9.57% drop over the last seven days. The 24-hour trading volume has reached $128,079,916, indicating substantial market activity despite the recent downtrend.
The lowest point on the chart, noted at $0.00619681, acts as a potential support level if the price drops further. Additionally, the lower boundary of the wedge also serves as a support line, reinforcing the structure of the bullish reversal pattern.
Technical indicators point to low volatility
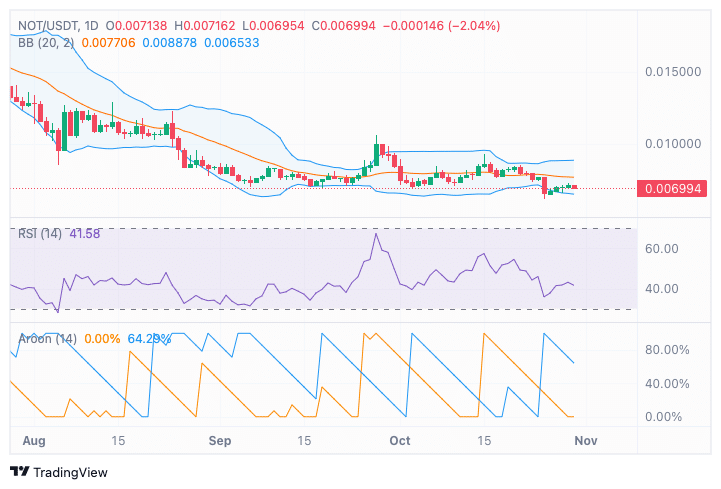
The Bollinger Bands on the daily chart reveal low volatility, with the price currently hovering near the lower band. This positioning suggests a possible oversold condition, which might lead to a move toward the middle band.
Meanwhile, the Relative Strength Index (RSI), sitting at 41.58, indicates weak momentum but is not in a fully oversold zone. If the RSI climbs above 50, it could signal a shift toward stronger bullish momentum, whereas a dip below 30 would point to intensified selling pressure.
The Aroon indicator shows a negligible uptrend and a moderate downtrend of 64.29%, reflecting the current bearish control.
For a potential trend shift, the Aroon Up needs to increase, which would point to a growing bullish presence in the market.
Large holders maintain control, impact on Bitcoin
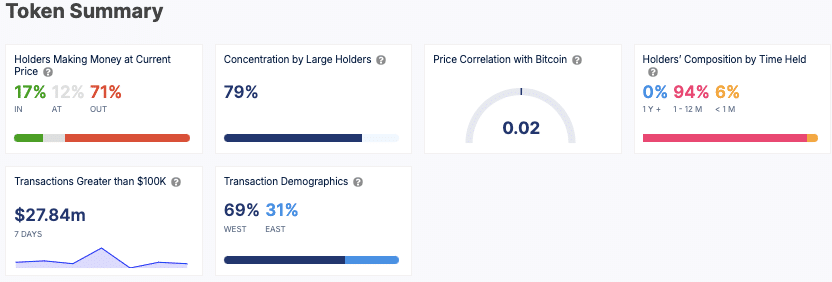
IntoTheBlock data indicated that 71% of Notcoin holders are currently at a loss, while only 17% are in profit at the current price.
This demonstrates that most investors are currently below their entry points, a factor that could influence trading behavior.
Furthermore, 79% of the supply is held by large holders, signifying that whales control a significant share of the circulating supply.
This high concentration could contribute to increased price volatility, especially during significant market movements.
Notcoin’s correlation with Bitcoin is notably low, measured at 0.02, indicating that it operates largely independently of BTC’s price movements.
Read Notcoin’s [NOT] Price Prediction 2024–2025
The holding composition reveals that 94% of holders have retained the token for 1-12 months, indicating a mid-term commitment to the asset.
In contrast, only 6% of holders are new, suggesting limited recent adoption or interest.


