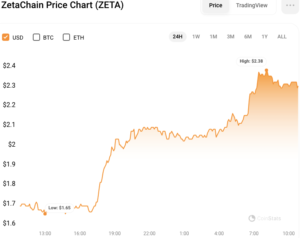
In just one day, ZetaChain (ZETA) saw a remarkable surge of 38.97%, hitting a new peak of $2.39, driven by positive sentiment in the cryptocurrency market.
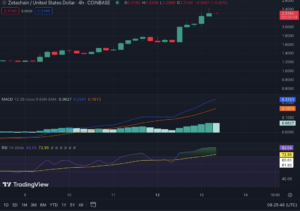
However, with ZETA’s Relative Strength Index (RSI) standing at 80, it indicates that the asset may be overbought, signaling a possible correction. On the other hand, the Moving Average Convergence Divergence (MACD) indicator suggests a strong bullish trend for ZETA, which could support additional price increases.
ZetaChain (ZETA) Surges Amid Crypto Market Optimism
In the past 24 hours, ZetaChain (ZETA) experienced a notable uptrend, driven by overall optimism in the crypto market fueled by Bitcoin’s surge to a three-year high. Beginning from a daily low of $1.65, the price of ZETA climbed significantly, reaching an all-time high of $2.39 before encountering resistance. As of the latest update, ZETA is trading at $2.33, marking a remarkable 38.97% increase from its intraday low and an impressive 86.55% surge over the previous week.
The surge in ZETA’s price is attributed to heightened interest and demand among investors, who see significant growth potential in the cryptocurrency. Additionally, the positive sentiment surrounding Bitcoin’s recent achievements has bolstered confidence in the broader crypto industry, prompting increased investment in altcoins like ZETA.
ZetaChain (ZETA) Outlook: Analyzing Market Dynamics

ZETA/USD 24-hour price chart (source: CoinStats)
ZetaChain (ZETA) has seen remarkable growth in its market capitalization and trading volume, surging by 38.17% and 79.42%, respectively, to $548,986,397 and $163,073,616. This surge reflects increased investor interest and activity in the cryptocurrency.
However, the Relative Strength Index (RSI) on the ZETAUSD 4-hour price chart has hit 80, signaling that ZETA may be overbought and due for a potential correction. Despite this, ZetaChain’s strong momentum and overall bullish sentiment may continue to drive its price higher in the short term.
Should the current optimism persist, ZETA could potentially surpass its previous all-time high and reach new price levels. Nevertheless, investors should remain cautious as the overbought condition could lead to a temporary pullback or market consolidation.

ZETA/USD 4-hour price chart (source: TradingView)
On the technical side, the Moving Average Convergence Divergence (MACD) indicator is in the positive range with a reading of 82.18, indicating a robust bullish trend for ZETA. This trend, coupled with an increasing MACD histogram, suggests growing buying pressure. If these indicators continue to show positive signals, ZETA’s price could sustain its upward trajectory.
Important: Please note that this article is only meant to provide information and should not be taken as legal, tax, investment, financial, or any other type of advice.
Join Cryptos Headlines Community
Follow Cryptos Headlines on Google News


