Bitcoin’s rise above $50,000 had a positive impact on Stacks (STX) and Ordi (ORDI) prices. STX saw a 6.19% increase, reaching around $2, while ORDI surged by 15.20%, surpassing $70 in the last 24 hours.
Both STX and ORDI have ties to Bitcoin, with STX being a layer two (L2) on the Bitcoin network and ORDI being the top BRC-20 token. This connection often leads to price movements in line with Bitcoin’s performance.
STX Price Analysis: Potential Upside Amidst Bullish Momentum
On the 4-hour chart, Stacks (STX) displayed signs of further potential upside, with the current price sitting at $1.98, reflecting a bullish bias in recent trading.
Supporting this upward trend is the Awesome Oscillator (AO) indicator, currently showing a reading of 0.16 with green histogram bars, signaling increased upward momentum for STX. If this positive AO reading persists, STX could retest the $2 mark.
However, the movement of Bitcoin (BTC) could influence STX’s trajectory. Should Bitcoin maintain its position above $50,000 or even climb to $52,000, STX may experience a further surge of around 10%. Conversely, a drop in Bitcoin’s price below this threshold could lead to a decrease in STX’s price.
Meanwhile, volatility surrounding STX has been on the rise, as indicated by the Bollinger Bands (BB). STX recently touched the upper band of the BB at $1.98, suggesting a potential overbought condition.
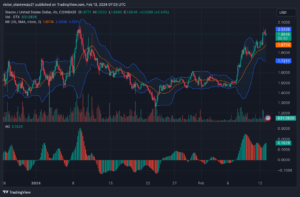
STX/USD 4-Hour Chart (Source: TradingView)
In a scenario of increasing volatility from a bearish perspective, STX could experience a downturn to $1.76. However, in a highly bullish scenario, intensified buying pressure might propel STX to $2.10.
ORDI Price Analysis: Bullish Momentum Continues Amidst Resistance
The break above the $65.19 resistance level demonstrated the resilience of bulls in driving ORDI’s price upward, with the token surpassing $70.
On the 4-hour chart, a minor resistance was observed at $70.90. If ORDI successfully breaches this level, it could potentially accelerate towards $80. However, similar to STX, the extent of this potential surge is contingent upon Bitcoin’s price movement.
A bullish rally for BTC could propel ORDI closer to the $80 mark. Conversely, a failure to defend BTC at $50,000 might lead to a decline in ORDI’s price, potentially falling to $61.23. Notably, ORDI’s price has closed above the 9 EMA (blue) and 20 EMA (yellow), affirming a bullish outlook for the token.
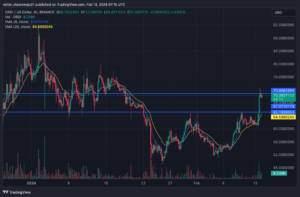
ORDI/USD 4-Hour Chart (Source: TradingView)
As long as ORDI remains above the EMAs, there is a possibility for further upward movement towards $80. However, a close below either the 9 or 20 EMA could signal a downward trajectory for the price.
Important: Please note that this article is only meant to provide information and should not be taken as legal, tax, investment, financial, or any other type of advice.
Join Cryptos Headlines Community
Follow Cryptos Headlines on Google News
Author