
Last month, Bitcoin Cash (BCH) saw a huge jump of 133%, climbing to approximately $681 according to Fibonacci levels. However, it couldn’t sustain that momentum and faced a rejection, leading to a corrective phase this month. The length of this correction is yet to be determined.
Bitcoin Cash (BCH) experienced a remarkable 133% surge last month, reaching a Fibonacci resistance level at $681 before encountering bearish rejection. Presently, the cryptocurrency is undergoing a corrective phase, finding significant support at $480, with additional golden ratio support identified at $325. Analysis of the weekly chart suggests a potential golden crossover, while daily indicators signal bearish trends, hinting at the formation of a death cross in the short term.
Bitcoin Cash (BCH) Corrective Movement After 133% Surge
Last month, Bitcoin Cash experienced a remarkable surge of approximately 133.5%, reaching a notable resistance level at the 0.382 Fibonacci level around $681. However, this level proved to be a significant barrier, leading to a corrective movement this month.
Since then, BCH has corrected by over 38%, currently encountering considerable Fibonacci support around $480. Should this support be breached, the next significant level of support lies at approximately $325, aligning with the golden ratio. Additionally, the 50-month Exponential Moving Average (EMA) serves as additional support.
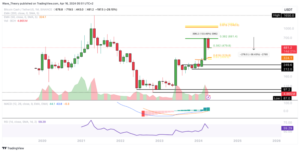
Bitcoin Cash (BCH) Price Chart. Source: Tradingview
Analyzing the monthly chart, the Moving Average Convergence Divergence (MACD) histogram shows a bullish trend, with MACD lines crossing in a bullish manner. Meanwhile, the Relative Strength Index (RSI) remains neutral, indicating a balanced market sentiment.
Bitcoin Cash (BCH) Weekly Chart Analysis: Potential for Golden Crossover
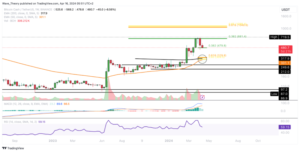
Bitcoin Cash (BCH) Price Chart. Source: Tradingview
In the weekly chart of Bitcoin Cash (BCH), there’s a notable potential for the Exponential Moving Averages (EMAs) to form a golden crossover, indicating a bullish trend in the medium term. Additionally, the Moving Average Convergence Divergence (MACD) lines have already crossed in a bullish manner. However, the MACD histogram has been declining bearishly since last week.
Despite these mixed signals, the Relative Strength Index (RSI) indicates neutral territory. Bitcoin Cash (BCH) is currently poised to rebound from the .382 Fibonacci support level around $480, suggesting a potential for bullish momentum in the near term.
Subsequently, BCH may attempt to breach the .382 Fibonacci resistance level at approximately $681.4. A successful breakout beyond this level could pave the way for a bullish trajectory towards the next target of around $1,050.
Should Bitcoin Cash surpass the golden ratio resistance at approximately $1,050, it would signify the beginning of a new bullish cycle for the cryptocurrency, potentially leading to further price appreciation.
Bitcoin Cash (BCH) Daily Chart Analysis: Bearish Signals Prevail
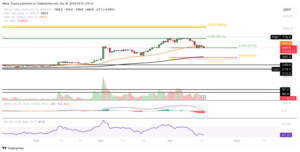
Bitcoin Cash (BCH) Price Chart. Source: Tradingview
Analyzing the daily chart of Bitcoin Cash (BCH), the indicators point towards bearish trends. Specifically, the Moving Average Convergence Divergence (MACD) histogram is trending downward, indicating a bearish momentum. Additionally, the MACD lines have crossed in a bearish manner, further confirming the prevailing bearish sentiment.
While the MACD signals bearish trends, the Relative Strength Index (RSI) is currently in neutral territory, suggesting a lack of strong directional bias at the moment.
In the event that Bitcoin Cash (BCH) breaks its current support levels, notable support can be anticipated at the Golden Ratio level of approximately $325. Furthermore, additional reinforcement is provided by the 200-day Exponential Moving Average (EMA), situated just below $340.
Overall, while the daily chart indicates bearish signals, the presence of significant support levels suggests potential opportunities for BCH to stabilize or rebound from current levels.
Bitcoin Cash (BCH) 4-Hour Chart Analysis: Potential Bearish Signals
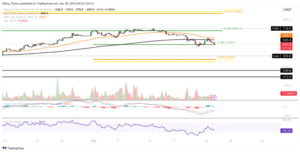
Bitcoin Cash (BCH) Price Chart. Source: Tradingview
Analyzing the 4-hour chart of Bitcoin Cash (BCH), there is a possibility of a death cross formation, which typically solidifies the trend as bearish in the short term. This pattern occurs when the short-term moving average crosses below the long-term moving average, indicating a potential downturn in price.
Furthermore, the Moving Average Convergence Divergence (MACD) histogram is displaying a downward trend, suggesting bearish momentum in the market. Additionally, the MACD lines are approaching a potential bearish crossover, further confirming the possibility of a short-term bearish trend.
Despite the bearish indicators, the Relative Strength Index (RSI) is currently in neutral territory. This means that it is not providing clear signals of either bullish or bearish momentum at the moment.
Overall, while the 4-hour chart of Bitcoin Cash (BCH) indicates potential bearish signals, traders should remain vigilant and monitor price movements closely for further confirmation of the short-term trend.
Bitcoin Cash (BCH) Faces Bearish Rejection Against BTC
Bitcoin Cash (BCH) recently experienced a bearish rejection against Bitcoin (BTC) at the resistance zone spanning from approximately 0.00999 BTC to 0.0108 BTC. This rejection indicates a struggle for BCH to surpass key resistance levels against BTC.
In light of this rejection, the BCH price is now encountering significant Fibonacci supports at around 0.0079 BTC and 0.0062 BTC. These levels are crucial for determining potential areas of price reversal or further downward movement.
Analyzing the monthly chart, while the Moving Average Convergence Divergence (MACD) lines maintain a bullish crossover, signaling a potential continuation of the long-term bullish trend, the MACD histogram shows a bearish inclination this month. Additionally, the Relative Strength Index (RSI) remains neutral, suggesting a lack of clear momentum direction at the moment.
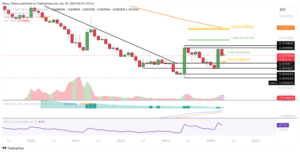
Bitcoin Cash (BCH/BTC) Price Chart. Source: Tradingview
Overall, the bearish rejection against BTC and the presence of key Fibonacci supports indicate a critical juncture for Bitcoin Cash (BCH) against its BTC trading pair. Traders should closely monitor price movements and key support levels for potential trading opportunities.
Important: Please note that this article is only meant to provide information and should not be taken as legal, tax, investment, financial, or any other type of advice.
Join Cryptos Headlines Community
Follow Cryptos Headlines on Google News
Author