
Bitcoin’s price held firm above the $33,200 support level and is currently on the rise, with potential plans to break through the $35,000 resistance and embark on a new rally.
“Bitcoin Bounces Back from Recent Dip, Eyes Higher Resistance Levels”
Bitcoin experienced a correction after testing the $35,000 resistance zone. It briefly fell below the $34,200 and $34,000 marks. Nevertheless, the bulls stepped in to support the price above the $33,200 level.
The cryptocurrency found a low near $33,250 and has since begun a fresh ascent. It convincingly surpassed the $34,000 resistance area. Furthermore, it climbed above the 50% Fibonacci retracement level of the previous drop, which ranged from the $35,225 high to the $33,250 low.
Currently, Bitcoin is trading above $34,000 and the 100-hourly Simple Moving Average. On the hourly chart of the BTC/USD pair, a significant bullish trend line is taking shape, offering support around $34,220.
In terms of resistance, the immediate hurdle lies near $34,750 or the 76.4% Fibonacci retracement level of the recent drop from the $35,225 high to the $33,250 low. The next noteworthy resistance level is at $35,000, with the primary barrier forming around the $35,200 zone.
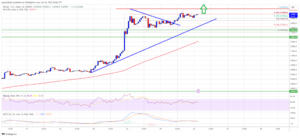
Source: BTCUSD on TradingView.com
A decisive move above the $35,200 level could potentially trigger another surge. In such a scenario, the next key resistance would be at $36,500. Further gains may even propel Bitcoin towards the $38,000 mark in the days ahead.
“Bitcoin’s Potential Downturn and Key Support Levels”
If Bitcoin is unable to surpass the $35,000 resistance area, it might face another downward move. Immediate support to watch on the downside is around the $34,200 mark and the established trend line.
The next significant support level is situated near $33,250. Should the price dip below this crucial support, there is a possibility of further declines. In such a scenario, Bitcoin’s price could potentially drop towards the $31,500 level in the upcoming sessions.
Technical Indicators:
- Hourly MACD: The MACD indicator is now showing strength in the bullish zone.
- Hourly RSI (Relative Strength Index): The RSI for BTC/USD is presently above the 50 level.
- Key Support Levels: $34,200, followed by $33,250.
- Key Resistance Levels: $34,750, $35,000, and $35,200.
Important: Please note that this article is only meant to provide information and should not be taken as legal, tax, investment, financial, or any other type of advice.
Join Cryptos Headlines Community
Follow Cryptos Headlines on Google News
Author