
In the last 12 hours, the price of Bitcoin has surged by more than 4%, breaking free from the recent period of stagnation. This upward movement comes after a breakout from a bullish pennant pattern, signaling Bitcoin’s intention to reach the $55,000 milestone.
Looking at the 4-hour BTC/USD chart, Bitcoin is currently priced at $44,609. It has just broken out of a bullish pennant pattern, which often indicates a bullish continuation, suggesting a potential upward price trend ahead.
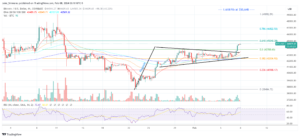
BTC price, 4-hour chart | Source: BTCUSD on TradingView.com
Bitcoin’s Bullish Signals: Analysis and Targets
The recent breakout from a bullish pennant pattern on the Bitcoin chart indicates a pause in trading before the market resumes its prior uptrend. This breakout typically suggests a continuation of the bullish trend, with the potential target often extrapolated from the length of the prior move, known as the flagpole, that initiated the pennant formation.
Moving Averages and Golden Cross Pattern
Bitcoin has displayed a golden cross pattern in its moving averages, with the 20-period EMA ascending above the 50-period EMA and the 100-period EMA. This pattern reinforces the bullish sentiment in the market.
Volume, a significant indicator of price movement strength, has shown an increase as the breakout occurred, further confirming the bullish scenario.
Applying the Fibonacci retracement tool from the swing high at $49,092 to the swing low at $38,484, Bitcoin’s price has broken above the 0.5 retracement level. The next critical levels to monitor are the 0.618 and the 0.786 Fibonacci levels, which may act as resistances in the short term.
Price Targets and Extensions
Beyond these levels, the full 1.0 extension and the 1.618 extension are on the horizon, with the latter aligning closely with the target of $55,000. This reinforces the significance of $55,000 as a potential price objective for Bitcoin.
Bitcoin’s Bullish Momentum and Key Considerations
The Relative Strength Index (RSI) stands at 73.47, indicating strong buying pressure. However, caution is advised as the market approaches overbought conditions. Bitcoin has historically reached very high RSI levels during its strongest moments, reflecting massive momentum. Traders should watch for potential divergence signaling a weakening of the current momentum.
Outlook and Potential Rally
Bitcoin’s breakout above the bullish pennant pattern suggests a potential rally towards the $55,000 mark. The convergence of the golden cross, increased volume, and Fibonacci extension levels provides further support for the bullish outlook.
Despite the bullish signals, traders should remain vigilant of overbought conditions that may trigger a retest of key support levels. The most crucial support is at the 0.5 Fibonacci level ($43,788), followed by support levels at 0.382 ($42,536) and 0.236 ($40,988). A sustained move below these levels could challenge the bullish thesis, shifting focus to the next significant support at $38,484.
Important: Please note that this article is only meant to provide information and should not be taken as legal, tax, investment, financial, or any other type of advice.
Join Cryptos Headlines Community
Follow Cryptos Headlines on Google News
Author