BNB Chain has demonstrated strong performance and robust activity over the years. Recently, the blockchain has once again proven its strength by outperforming all its competitors in a key area.
This impressive showing raises the question of whether it will finally provide the momentum needed for bulls to drive BNB’s price upward.
BNB Chain Leads in Unique Addresses Despite Mixed Metrics
Coin98 Analytics recently revealed a significant development: BNB Chain was the top blockchain in terms of unique addresses over the last 30 days, surpassing 463 million. Despite a modest 1% growth compared to the previous month, BNB Chain led the field. Polygon (MATIC) and Ethereum (ETH) also ranked in the top three, with MATIC recording 452 million unique addresses and ETH at 277 million.
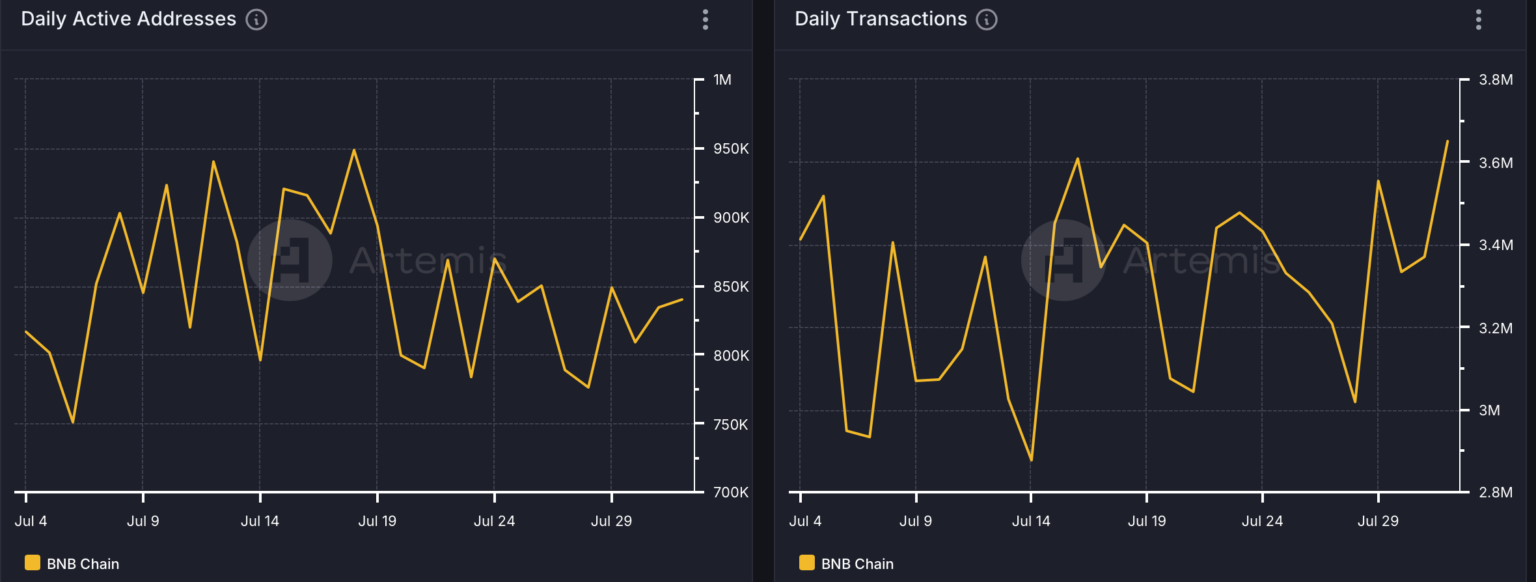
Data from Artemis provides further insights into BNB Chain’s network activity. Although the blockchain’s daily transactions increased over the past month, it was notable that BNB’s daily active addresses declined during the same period.

Source: Artemis
Additionally, after a sharp rise, BNB Chain’s total value locked (TVL) began to decrease on the charts. However, despite these fluctuations, the overall picture remains positive, with both transaction fees and revenue showing recent upward momentum.
BNB Chain Faces Bearish Pressure Despite Milestone Achievement
Despite hitting a new milestone, BNB Chain’s price action has remained under bearish control, with its value dropping over 8% in the last seven days and 5% in the past 24 hours. As of now, BNB is trading at $538.20 with a market capitalization exceeding $78.5 billion.
The altcoin’s bearish price movement has negatively impacted its social metrics. The weighted sentiment for BNB has decreased, indicating a dominant bearish outlook in the market. Conversely, its social volume has increased, reflecting BNB’s ongoing popularity in the crypto space.
Coinglass data reveals a sharp decline in BNB’s long/short ratio, signaling more short positions in the market than long positions—a bearish indicator. Further analysis of the coin’s daily chart shows that BNB’s price has dipped below the lower limit of the Bollinger Bands, suggesting a potential for further price declines.

Source: Coinglass
Additionally, both the Money Flow Index (MFI) and Chaikin Money Flow (CMF) have registered downticks. BNB is currently testing a crucial support level, and a fall below this could have severe consequences. However, this situation also presents an opportunity for bulls to defend their position and potentially initiate a rally.
Important: Please note that this article is only meant to provide information and should not be taken as legal, tax, investment, financial, or any other type of advice.
Join Cryptos Headlines Community
Follow Cryptos Headlines on Google News


