Price Prediction for October 24")


Bonk, the digital asset, has experienced a sharp drop in its market value, losing almost half of its peak value according to recent price charts.
This significant decline emphasizes the dangers of investing in highly unpredictable digital assets, especially ones like BONK that might be more affected by their trendy or “meme” appeal rather than their underlying fundamentals. Investors should be cautious when dealing with such volatile assets, as their value can be influenced by factors beyond traditional financial metrics.
Crypto Rollercoaster: BONK’s Parallels with Shiba Inu
The analysis of BONK’s price movement reveals a familiar tale—a rapid ascent followed by a sharp decline, reminiscent of the trajectory seen in other meme coins like Shiba Inu. These cryptocurrencies often attract attention and investment through social media hype and speculative trading, resulting in quick and substantial price increases.
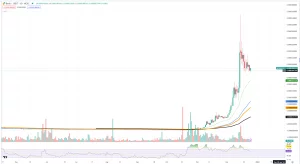
BONK/USDT Chart by TradingView
However, lacking solid technological or economic foundations, these coins are prone to equally swift declines, leaving investors with significant losses. This situation is particularly worrisome for those involved in leveraged investments, where gains can be magnified during market upswings but losses can be equally amplified when prices fall.
The recent halving of BONK’s value serves as a stark reminder of the dangers associated with leveraging in the volatile cryptocurrency market, where the margin between profit and loss is exceptionally narrow. BONK’s trajectory closely mirrors that of Shiba Inu, which initially captured the cryptocurrency scene’s imagination but struggled to maintain its meteoric heights, ultimately leading to substantial pullbacks.
Decoding Dogecoin’s Potential Reversal at Key Support
As Dogecoin encounters a crucial support level, investors are eyeing a potential trend reversal on the horizon. Notably, traditional meme coins like DOGE often showcase reversals during the final stages of highly volatile markets, signaling a potential turning point. The current chart reveals DOGE’s proximity to the 26-day exponential moving average (EMA).
While the 26-day EMA is a staple in stock market analysis, offering dynamic support or resistance based on the average closing prices over the past 26 days, its application to Dogecoin’s chart appears valid. Despite its origins in equities, this indicator finds relevance in the crypto realm due to its ability to provide a smooth and responsive analysis, crucial for the fast-paced nature of cryptocurrency markets.
The rationale behind this lies in the fact that, despite cryptocurrency’s reputation for volatility, it still adheres to some fundamental principles of technical analysis. The EMA, acting as a refined version of the simple moving average, proves particularly suitable for the swift movements typical of the crypto market.
In the current scenario, Dogecoin’s approach to the 26-day EMA aligns with a decrease in trading volume, as indicated by the volume bars beneath the price chart. This convergence suggests a potential consolidation phase, often preceding a significant price movement. The declining volume implies diminished selling pressure, and when coupled with the support provided by the EMA, it raises the possibility of a bullish reversal.
Solana (SOL): Early Signals Hint at Possible Correction
The price chart of Solana (SOL) is displaying initial indicators that suggest a potential reversal, signaling a forthcoming correction phase. A recent candlestick formation on the chart exhibits characteristics commonly associated with trend exhaustion, often preceding a shift in market sentiment.
Upon closer analysis, a specific candle with a pronounced upper shadow stands out, indicating that while buyers initially drove the price higher, a substantial sell-off occurred, pulling the price down from its peak. Such price action typically signifies market uncertainty and serves as an early warning of a potential shift, especially following a robust uptrend.
Technical indicators further support the notion of overextension in Solana’s recent price surge. The Relative Strength Index (RSI) has entered overbought territory, surpassing the 70 level for an extended period. Historically, such elevated RSI readings suggest that the asset may be ripe for a retracement.
Considering Solana’s rapid ascent to a market capitalization of 48 billion USD, making it the third-largest cryptocurrency by market cap, questions arise regarding the sustainability of its rally from both technical and financial perspectives.
Investors and traders should be mindful that the initial signs of a potential reversal, combined with an extremely overbought status, could indicate an impending period of price consolidation or correction for Solana.
Important: Please note that this article is only meant to provide information and should not be taken as legal, tax, investment, financial, or any other type of advice.
Join Cryptos Headlines Community
Follow Cryptos Headlines on Google News