


In the past month, BONK’s futures open interest dropped by more than 25%. This means fewer people are trading in BONK’s future contracts. Also, indicators suggesting the price might fall were noticed.
In the past month, BONK’s price went down by almost 30%. Now, the charts are saying it might drop even more in the future.
BONK Bucks Trend with 27% Price Decline
Despite a surge in the memecoin market, Solana-based meme coin Bonk [BONK] saw a 27% price decline in the last month, as per CoinMarketCap’s data.
During the 30-day period, there was a notable decrease in BONK’s daily trading volume. Santiment’s data reveals a staggering 73% drop in daily trading volume for BONK over the past month.
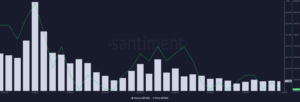
Source: Santiment
BONK Technical Indicators Suggest Further Decline
An assessment of BONK’s key technical indicators on a 1-day chart hinted at the possibility of a continued decline in the memecoin’s value. The Directional Movement Index (DMI) signaled the dominance of bears in the market, with the positive directional index (blue) positioned below the negative index (red) since April 9th. This setup indicates that downward price movement is stronger than any potential upward correction.
Furthermore, the altcoin’s key momentum indicators were observed below their respective neutral lines at the time of analysis. BONK’s Relative Strength Index (RSI) stood at 45.28, while its Money Flow Index (MFI) was recorded at 45.09. These values indicate that BONK distribution outweighed accumulation, exerting downward pressure on its price.
Bearish Signs Persist for BONK
In addition to other indicators, BONK’s Elder-Ray Index has consistently posted negative values since April 2nd. This index measures the balance between the strength of buyers and sellers in the market. A negative value indicates increased selling activity, highlighting the growing influence of bears.
Confirming the dominance of bears, BONK’s Moving Average Convergence Divergence (MACD) line was observed below both the signal and zero lines at the time of analysis. When an asset’s MACD line falls below its signal line and registers a negative value, it signals a bearish trend. This suggests that the short-term trend is weaker than the longer-term trend, prompting traders to consider exiting long positions and potentially taking short ones.
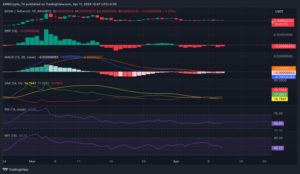
Source: BONK/USDT on TradingView
BONK Derivatives Market Dynamics
In BONK’s derivatives market, futures open interest has plummeted by 65% since March 5th, according to Coinglass data. This significant decline indicates a notable reduction in the number of outstanding futures contracts for BONK.
Despite the sharp decrease in futures open interest, BONK’s funding rate across cryptocurrency exchanges has remained positive. This suggests that participants in the futures market have continued to take long positions, expecting a potential uptrend in the value of BONK.
Important: Please note that this article is only meant to provide information and should not be taken as legal, tax, investment, financial, or any other type of advice.
Join Cryptos Headlines Community
Follow Cryptos Headlines on Google News