Solana is moving past the $35 resistance level against the US Dollar, and the price of SOL is well-supported. It’s possible that there will be a new rally aiming for $38.
SOL’s price initiated a significant rally, surpassing the $32 resistance against the US Dollar. Currently, it’s trading above $35 and is also positioned above the 100 simple moving average over a 4-hour timeframe.
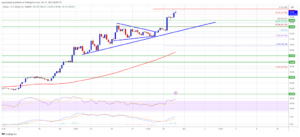
Notably, a crucial bullish trend line is taking shape, with support at around $33.30 on the SOL/USD 4-hour chart, utilizing data from Kraken. The pair has already experienced a nearly 10% increase and could potentially extend its surge towards the $38 resistance level.
Solana has shown a strong upward trend, securing its position above the $30 pivot level. It gained bullish momentum after establishing a base above $30 and $32.
What’s remarkable is that Solana is now outperforming both Bitcoin and Ethereum. It made a clear move above the $35 resistance zone, reaching a new multi-week high at approximately $36.48. Currently, the price is consolidating gains above the 23.6% Fibonacci retracement level of the upward move from the $32.34 low to the $36.48 high.
SOL is trading above $35 and is also above the 100 simple moving average over a 4-hour period. On the 4-hour chart of the SOL/USD pair, there’s a crucial bullish trend line forming, offering support around $33.30.

Source: SOLUSD on TradingView.com
Looking ahead, the immediate resistance is close to the $36.50 level, with the first major resistance near $36.80. A successful break above this resistance could pave the way for more significant gains. The next notable resistance level to watch for is around $38.00. Further upward movement might drive the price towards the $40.00 level.
Is SOL Experiencing Limited Dips?
If SOL struggles to recover above the $36.50 resistance, it might initiate a downward correction. Initially, support on the downside can be found near the $34.40 level.
The primary support comes around the $33.30 level, which includes the trend line area and the 76.4% Fibonacci retracement level from the low at $32.34 to the high at $36.48. If the price drops below the $33.30 support, it could head towards the $32.00 support in the near future.
Technical Indicators
- The 4-Hour MACD (Moving Average Convergence Divergence) for SOL/USD is showing increasing bullish momentum.
- The 4-Hour RSI (Relative Strength Index) for SOL/USD is above the 50 level.
- Key Support Levels – $34.40 and $33.30.
- Key Resistance Levels – $36.50, $36.80, and $38.00.
Important: Please note that this article is only meant to provide information and should not be taken as legal, tax, investment, financial, or any other type of advice.
Join Cryptos Headlines Community
Follow Cryptos Headlines on Google News


