
According to Trend Rider, Cardano (ADA) might be poised for a significant upward trend. The analyst pointed out a positive pattern between two key moving averages, suggesting good prospects for ADA in the long term. They also noted similarities to a previous surge in ADA’s price, from $0.11 to $3.00.
CoinMarketCap data reveals that ADA’s remarkable surge from $0.11 to $3 unfolded between December 2020 and September 2021, spanning approximately 10 months. Considering this timeline, it’s possible that a similar bullish pattern could lead to another substantial increase in ADA’s value, albeit over a similar duration.
ADA/USD Daily Chart Analysis: Potential Upside Towards $0.70
Analysis of the ADA/USD daily chart suggests a positive market sentiment that could drive the price towards $0.70. However, the short-term outlook indicates potential resistance around $0.65, hindering a breakthrough.
Currently trading at $0.59, ADA faces a notable resistance at $0.60. A failed attempt to surpass this zone could lead to a decline towards $0.55. Conversely, a successful close above $0.60 might pave the way for a retest of $0.68.
Notably, the 50-day Exponential Moving Average (EMA) has crossed above the 200-day EMA, forming a golden cross. This pattern typically signals a bullish breakout, suggesting potential for ADA’s price to rise significantly in the long run.
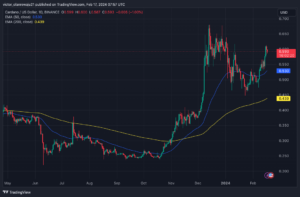
ADA/USD Daily Chart (Source: TradingView)
ADA Price Forecast: Potential Upside to $1.18 Amid Market Optimism
Amid prevailing market optimism, ADA could potentially surge by another 100% within the next few months, reaching a price target of $1.18. However, if bearish sentiment dominates, ADA’s price may stagnate or continue trading within the range of $0.55 to $0.60.
Currently, the Moving Average Convergence Divergence (MACD) on the ADA/USD 4-hour chart indicates a pause in bullish momentum, with the MACD dropping into negative territory. Additionally, the 12 and 26 Exponential Moving Averages (EMAs) are trending downwards, suggesting a potential bearish trend. If this downward momentum persists, ADA could retest support at $0.54, corresponding to the 0.236 Fibonacci level.
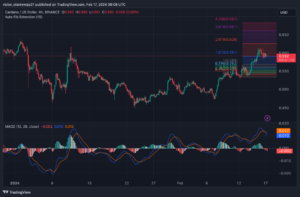
ADA/USD 4-Hour Chart (Source: TradingView)
On the other hand, a closer look at the Fibonacci retracement indicator reveals the potential for further upside in ADA’s price. If buying pressure resumes, ADA may experience a 13% increase, pushing its price towards $0.68, aligned with the 4.236 Fibonacci level.
Important: Please note that this article is only meant to provide information and should not be taken as legal, tax, investment, financial, or any other type of advice.
Join Cryptos Headlines Community
Follow Cryptos Headlines on Google News
Author